Full Report
What the industry sells
A tyre is a consumable safety component. It wears out on a schedule set by kilometres driven, not by the vehicle's replacement cycle, which means the industry has two distinct demand streams sitting on top of one another. The first is original equipment (OE): tyres sold to a vehicle manufacturer and fitted on the assembly line, priced against competing suppliers on cost and reliability of supply. The second is replacement: tyres sold through distributors and retail stores to the person who already owns the vehicle, where brand recognition, quality reputation, responsiveness and an after-sales service network do the differentiating. Prinx Chengshan's own listing document states the split plainly — in OE, "competitive price and reliable supply capacity are placed at top priorities", while in replacement, brand, "trustable quality, innovation and quick reaction capability, as well as well-developed distribution and sales channel and after-sale service system are crucial" [1].
Products divide into three families by construction:
- All-steel radial tyres, also called truck and bus radial or TBR. Fitted to medium and heavy trucks, large buses, semi-trailers and some light trucks [2].
- Semi-steel radial tyres, or passenger car radial (PCR). All passenger vehicles and a small share (under 10%) of commercial vehicles, mainly light trucks and mini vans [3].
- Bias tyres, an older cross-ply construction for heavy loads on poor surfaces — mines, quarries, tunnels, agricultural and industrial use. A shrinking residual: China's radialisation rate reached 96% of automotive tyre output in 2025 [4].
A fourth family, off-the-road (OTR) tyres for mining and construction machinery, sits adjacent and carries higher unit prices; Prinx Chengshan began trial production of its first OTR line in the fourth quarter of 2025 [5].
The economic organising principle is that a tyre maker is a rubber converter with a brand and a distribution network attached. Raw materials dominate the cost line, plants are capital-intensive and want to run flat out, and the difference between a good year and a bad one is mostly the gap between input prices and realised selling prices — a gap that opens and closes with a lag.
The value chain and where the money sits
Four inputs account for most of the bill of materials: natural rubber, synthetic rubber, carbon black and steel cord [6]. At the time of listing, raw materials were 68.2%, 74.5% and 78.4% of total cost of sales in 2015, 2016 and 2017, with rubber alone at 35.4%, 39.4% and 43.2% [7] [8]. Nothing structural has changed since: in FY2025 raw materials and consumables were ¥8,400.2 million against ¥10,683.6 million of total cost of sales and operating expenses [9].
Sources: raw materials and consumables used, RMB6,209,793 thousand in FY2021 to RMB8,400,212 thousand in FY2025, per the expenses by nature note in the FY2021, FY2023 and FY2025 annual reports [10] [11] [12]; the revenue denominators, RMB11,806,801 thousand in FY2025 back to RMB7,537,161 thousand in FY2021, from the five-year profit or loss summary [13]; the reported gross profit margin series of 18.1%, 21.2%, 21.3%, 14.3% and 13.8% from the five-year key financial indicators [14], with the FY2025 decline explained in the financial review [15]. Ratios derived.
Raw material intensity is a blunt instrument — inventory sits between the purchase and the sale, so the cost line lags the spot market and price increases lag cost growth again behind that [16] — but the shape is the industry's shape. The two years when the input share was highest, FY2021 and FY2022, were the two years of thinnest margin.
Input prices did not move together in 2025. Triangle Tyre's annual report plots natural rubber opening the year near US dollars 2,000 per tonne before falling back below US dollars 1,750, while synthetic rubber and carbon black traded below their 2024 levels for most of the year and steel cord did so only through July [17].
Source: values read from the natural rubber price chart (Singapore Exchange data) in Triangle Tyre's FY2025 annual report; figures are approximate to the plotted series [18].
Downstream of the plant, output flows through two channels with materially different economics. Prinx Chengshan sold 83.7% of FY2025 revenue through distributors — 17.6% domestic and 66.1% international — and 16.3% direct to vehicle manufacturers [19]. The replacement leg terminates in a retail network the manufacturer does not own but does organise: 126 domestic distributors, 25,389 registered retail stores, and 8,078 stores enrolled in the company's dealer app as of the end of 2025 [20].
Two of the six Chinese makers in this corpus disclose gross margin by channel, and both show the replacement channel earning more than OE. Every one of the six shows overseas sales earning more than domestic sales, and that domestic-versus-overseas margin record is in Competition.
Sources: FY2025 annual reports — Sailun [21]; Linglong [22]; Triangle [23]; Jiangsu General [24]; Guizhou [25]; Prinx Chengshan segment results divided by segment revenue [26].
The bases are not identical and should not be read as one series. Prinx Chengshan reports two geographic segments defined by operating location — the Shandong plant and the Thailand plant — so its split is by where the tyre was made [27]. The A-share peers split by where the tyre was sold. Both cuts point the same way, but they answer slightly different questions.
Market size, and what the numbers actually measure
There is no single agreed measure of this market, and the two credible bases in this corpus are five years and one definition apart.
The most recent read comes from Sailun's FY2025 annual report, which uses Michelin's published market data: global tyre sales of roughly 1.9 billion units in 2025, with Europe at 27.6% and North America at 22.87% of global volume — together more than half — and Europe up 0.54% while North America fell 0.57%. China's passenger and truck and bus tyre sales totalled about 382 million units, up 5% [28].
The older read comes from Prinx Chengshan's 2018 listing document, commissioned from Frost and Sullivan: global automotive tyre sales of 3,039.0 million units in 2017, growing at a 3.3% compound rate from 2012 and forecast at 2.0% to 2022; China at 609.0 million units in 2017, growing at 9.0% from 2012 [29] [30].
The gap between 3.0 billion and 1.9 billion units is scope, not decline: the Frost and Sullivan series counts all automotive tyres including bias and every vehicle class, while the Michelin-based series counts the passenger, light truck and truck and bus categories the major manufacturers compete in. Any share estimate is only meaningful against one of these denominators, stated. This tab does not compute a global share for any company, because the corpus does not contain a single consistent global denominator and a company-level global volume for the same year.
Inside China, the annual statistics are firmer, and 2025 is the year the growth stopped.
China tyre output 2025 (m units)
▲ 0.9% YoY
China tyre exports 2025 (m units)
▲ 3.1% YoY
Export value growth 2025
▼ -5.9% Rubber and plastics sector profit
Sources: National Bureau of Statistics and General Administration of Customs data as quoted in Prinx Chengshan's FY2025 annual report [31]; sector revenue and profit change from Triangle Tyre's FY2025 annual report [32].
Output of 1.207 billion rubber tyres grew 0.9%, against 9.2% the year before [33] [34]. Exports of new pneumatic rubber tyres reached 702 million units, up 3.1%, but export value rose only 1.8% to ¥161.123 billion — unit export prices fell [35]. Within that, passenger car tyre exports actually declined 1.9% to 342 million units while truck and bus tyre exports rose 2.7% to 130 million [36]. Across the whole rubber and plastics products sector, China's National Bureau of Statistics recorded revenue down 1.4% and total profit down 5.9% [37].
The same statistic, three different numbers
Four of the makers in this corpus quote 2025 industry data from different trade sources, and the numbers do not reconcile. This matters for anyone building a model off a single filing.
Sources: Prinx Chengshan FY2025 annual report, on all-steel output of 149 million units and semi-steel utilisation of 74.03% [38]; Linglong FY2025 annual report [39]; Triangle FY2025 annual report [40]; Guizhou FY2025 annual report [41].
The utilisation lines deserve particular care. Sublime China Information and the China Rubber Industry Association's tyre branch survey different plant populations, so their levels differ by roughly five percentage points in both product categories — and for semi-steel they disagree on the size of the fall, 3.62 points against 9.6. Levels from different providers cannot be chained into one series, and even the same provider's level has been restated: Prinx Chengshan's FY2024 report gave all-steel utilisation of 58.5%, while its FY2025 report gives 69.23% described as up 4.72 points [42] [43].
Who pays, and where the volume ends up
Demand comes from two places and neither is the driver. OE demand tracks new vehicle build; replacement demand tracks the vehicle parc and how hard it is driven. China produced 34.53 million vehicles and sold 34.40 million in 2025, up 10.4% and 9.4% — a record — with commercial vehicles back above 4 million units at 4.261 million produced, up 12% [44] [45]. New energy vehicle production and sales reached 16.626 million and 16.49 million units, up 29% and 28.2%, a 47.9% share of new sales. The parc reached 366 million vehicles, of which new energy vehicles were 43.97 million, or just over 12% [46].
The gap between those two numbers — a 47.9% share of the flow against a 12% share of the stock — is the shape of the next decade of replacement demand.
For an exporter, the destination map is a better guide than the segment map. Prinx Chengshan reports revenue by the region where goods were delivered; the four-year revenue-by-destination series is in Competition.
The Americas took ¥3,901.9 million, or 33.0% of revenue, in FY2025 — almost exactly the domestic share [47]. This is the arena's central exposure: the industry's marginal buyer is American or European, and both are raising the cost of entry.
The players that matter
The listed Chinese tyre makers with filings in this corpus, ranked by FY2025 revenue. All figures are in renminbi, all are calendar-year, and all five A-share peers were confirmed from their own filings to run the same model — radial tyre manufacture sold through a mix of OE and distributor-led replacement channels, with an overseas production base — Triangle's is the exception, a Cambodian plant of 6 million semi-steel and 1 million all-steel radials still under construction through 2026 [48].
The peer scale, profit and margin record is in Competition.
The concentration picture is old but structurally informative. At the time of Prinx Chengshan's listing, the top ten domestic-brand players held 26.6% of Chinese all-steel radial volume, and the majority of domestic producers were described as sub-scale and competing in medium and low-end segments [49]. The barriers that keep the top of the industry stable are certification (CCC domestically, DOT in North America, ECE in the European Union) and capital — the Ministry of Industry and Information Technology's tyre policy sets a minimum of ¥1.0 billion of investment for an annual capacity of 1.2 million radial tyres [50]. Qualifying as a supplier to a vehicle manufacturer adds an assessment period lasting many years [51].
The lines this industry divides on
Trade remedies, and the geography they price
The single most consequential structural force is that duties are levied on where a tyre was made, not on who made it. That converts plant location into a pricing variable and has driven a decade of offshore capital spending.
Sources: Prinx Chengshan FY2025 annual report, Risks and Uncertainties — the 17.06%, 4.52% and 5.08% Thai passenger and light truck rates [52], the 12.33% truck and bus rate and South Africa’s 6.61% preliminary rate [53], and the 15% Pillar Two minimum rate [54]; Sailun investor meeting record, 1 September 2025 [55]; Linglong FY2025 annual report [56]; Linglong FY2024 annual report [57].
The firm-specific United States and South African rates assigned to this group, and the dates they were set, are in History.
Two definitions that recur across these filings. A "double investigation" (双反) is a paired anti-dumping and countervailing duty case — the European Union opened the anti-dumping half against Chinese passenger and light truck tyres on 21 May 2025 and the countervailing half on 6 November 2025, and from 22 January 2026 required import registration so that duties can be applied retroactively [58]. An anti-circumvention case, like South Africa's, asks whether goods nominally from a third country are really Chinese goods routed through it; a preliminary 6.61% rate applies to Prinx Thailand while it is decided [59].
The industry's answer has been to move plants. The share of overseas capacity among China's top ten tyre companies rose from 18% in 2020 to 35% in 2023 [60]. Sailun, the first Chinese maker to build abroad, now has planned overseas capacity of 11.1 million truck and bus radials, 62 million passenger radials and 110,000 tonnes of off-road tyres across Vietnam, Cambodia, Indonesia, Mexico and Egypt [61]. Prinx Chengshan's own second offshore base, in Kedah Rubber City, Malaysia, is 6 million passenger radials and 600,000 truck and bus radials for a total investment of US dollars 299 million, with trial production expected in the fourth quarter of 2026 [62].
The exposure gap is arithmetic. In FY2025, 66.1% of Prinx Chengshan's revenue was denominated in US dollars or euros [63], while the Thailand base generated 38% of revenue [64]. The difference is hard-currency revenue produced inside the tariff perimeter.
Domestic overcapacity against export pull
Chinese producers describe the home market and the export market as two different games. Jiangsu General's FY2025 report names the domestic condition directly: structural overcapacity and rising manufacturing cost producing "price involution" on homogeneous products, while multinationals hold the high-end tier behind technology and brand barriers [65]. Guizhou Tyre describes an industry running with overcapacity, volatile input prices, slowing demand and trade barriers simultaneously [66]. Prinx Chengshan itself described the shift in FY2022: "The tire industry as a whole is in an oversupply situation, and market competition has shifted from incremental competition to stock competition" [67].
The spare capacity is not evenly distributed. Industry-wide utilisation in 2025 sat near 69% for all-steel and 74% for semi-steel [68], while Prinx Chengshan's own plants ran at 93.8% and 92.6% in Shandong and 80.6% and 92.5% in Thailand [69]. The idle lines sit in the industry's tail, which is where the price pressure originates.
Cost pass-through, and its lag
Raw material moves reach the income statement one to two quarters late, and selling prices move later still. Prinx Chengshan's FY2021 report is the clearest statement of the mechanism: input prices rose sharply, "the increase in raw material prices has not been fully transmitted to the selling price, resulting in a decline in the profit margin of the tire industry from the domestic market" [70]. The FY2024 report shows the same mechanism splitting the two product lines in one year: all-steel faced "dual pressures of oversupply and ineffective cost pass-through" with natural rubber up 22%, while semi-steel demand was strong enough that "pricing mechanisms" operated smoothly and margins held [71].
Pass-through is a live issue rather than a historical one. At Sailun's 8 May 2026 investor meeting, management answered a question on how it was handling rising raw material costs by saying, in terms, that it had already raised prices [72].
Standards, certification and the green barrier
Beyond tariffs, market access is increasingly gated on compliance rather than price. Product certifications — CCC, DOT, ECE, plus voluntary marks such as UN Regulation 164 for studded winter tyres and TÜV SÜD approval — are the entry ticket [73] [74]. Linglong's FY2025 report names the newer layer: the European Union's deforestation regulation, deferred to the end of 2026, will require rubber-containing products to prove a deforestation-free supply chain, forcing traceability systems across the whole chain, with the carbon border adjustment mechanism behind it [75] [76]. Tax rules have joined the list: OECD Pillar Two is now in force in Thailand, Malaysia and Europe, imposing a 15% minimum effective rate on groups above EUR 750 million of revenue, and Prinx Thailand has already provided for it [77].
Domestically, policy has pushed the same direction: China's carbon peaking and neutrality targets accelerated the elimination of outdated capacity and, on Prinx Chengshan's reading, raised industry concentration [78].
Where the cycle sits
Read across five years and six sets of accounts, this is an industry that has just turned over after a two-year margin peak, with volume still rising.
Sources: FY2023, FY2024 and FY2025 annual reports, Industry Dynamics [79] [80] [81]; Prinx Chengshan sales volume of 18.6 million sets in 2021 [82], 18.5 million in 2022 [83], 25.0 million in 2023 [84], 28.0 million in 2024 [85] and 29.3 million in 2025 [86]; gross margin as reported, 13.8%, 14.3%, 21.3% and 21.2% for 2021 to 2024 in the FY2024 key financial indicators [87] and 18.1% for 2025 in the FY2025 financial review [88]. Utilisation levels for 2023 and 2024 come from a different provider than 2025 and are not a continuous series; 2021 and 2022 industry statistics were not disclosed in these reports.
The sequence the filings describe:
2021 — cost shock. Raw material and energy prices rose, China's dual-control energy policy limited electricity use and production, shipping prices rose sharply, and price increases lagged. Prinx Chengshan's gross profit fell 25.8% on a 20.0% revenue increase; group gross margin was 13.8% [89] [90].
2022 — demand trough. Chinese commercial vehicle production and sales fell more than 30%, domestic replacement demand was weak, and the industry moved from growth competition to share competition. Freight normalised in the second quarter, which helped, but North American replacement demand fell away in the second half [91].
2023 — the upswing. China's tyre output rose 15.3% to 990 million units and exports 11.8% to 620 million, while raw material and freight costs fell and the renminbi weakened [92]. Semi-steel utilisation reached 69% and all-steel 60.2%. Prinx Chengshan's gross profit rose 81.4% and profit attributable to owners 162.4% [93].
2024 — the peak, already splitting. Output rose 9.2% and exports 10.5%, but all-steel and semi-steel diverged: all-steel production fell 2.26% with utilisation at 58.5% under weak logistics demand and 22% higher natural rubber prices, while semi-steel production rose 8.04% at 76.1% utilisation on new energy vehicle growth [94].
2025 — volume up, profit down. Output growth fell to 0.9%, export value grew slower than export volume, and five of the six listed makers in this corpus reported lower net profit — Sailun down 13.3% [95], Linglong 21.9% [96], Prinx Chengshan 17.1% [97], Triangle 16.3% [98] and Jiangsu General 46.1% [99], with only Guizhou roughly flat at plus 0.7% [100]. Four of the six saw gross margin contract. Guizhou's summary of the year — pressure in the first half, repair in the second, with structural differentiation intensifying — matches what the others describe [101].
The company-level version of that turn is visible in Prinx Chengshan's two production bases. The Thailand base carried a gross margin premium over Shandong in every year from FY2022, but that premium narrowed sharply in FY2025 as US duties on Thai-origin tyres took effect; the FY2022 to FY2025 series by base is in Business.
As of the FY2025 report date, order books had begun to diverge by base and product: all-steel orders at Shandong were described as sufficient while its semi-steel orders declined; at Thailand, all-steel orders were slightly weak while semi-steel held at normal levels [102].
Three currents running through this arena
The tariff wall now prices geography, and the industry is rebuilding its map around it. Overseas capacity among China's top ten went from 18% to 35% of the total between 2020 and 2023 [103], and the destinations have widened from Thailand and Vietnam to Cambodia, Indonesia, Mexico, Egypt, Hungary and Serbia [104] [105]. Each new location is a bet that the destination market's duty regime holds for the life of the asset — a bet that anti-circumvention cases such as South Africa's, and origin enforcement across Southeast Asia from September 2025, are designed to test [106] [107].
Product mix is moving faster than volume. Tyres of 17 inches and above were 44% of Chinese demand in 2024 as new energy vehicle penetration passed 40% [108]; Prinx Chengshan's own share of 17-inch-and-above products reached 51% in 2025 [109]. New energy vehicles impose specific requirements — low rolling resistance, higher load bearing, lighter construction for range — which the industry has responded to with dedicated product lines [110] [111]. Mix upgrade is the industry's stated answer to a price environment it cannot control.
The commercial and passenger halves are on different clocks. In 2024 all-steel output fell while semi-steel rose; in 2025 that reversed, with all-steel production up roughly 7% on export and OE strength while semi-steel growth slowed to 1.33% and its utilisation fell, hit in the fourth quarter by the European anti-dumping investigation [112] [113]. For a maker with 56.5% of revenue in all-steel and 41.8% in semi-steel, the two halves rarely peak together [114].
What the record here cannot settle
The corpus supports the structure above but not everything a reader might want. Four gaps are worth stating plainly.
Market share cannot be computed on a current basis. The only company-level share data in the corpus is Frost and Sullivan's 2017 ranking from the listing document, which anonymises every competitor except Prinx Chengshan itself and covers only all-steel radial tyres sold in China [115].
Profit pools cannot be allocated across the chain. The corpus contains no financial statements for rubber producers, carbon black or steel cord suppliers, distributors or retail chains, so the split of industry profit between input suppliers, manufacturers and the channel is not measurable from primary documents here.
Peer margins are not strictly comparable. The A-share filings report gross margin on main business revenue and split it by sales region; Prinx Chengshan reports on total revenue and splits by production base. The direction of the overseas premium is consistent across all six, but the levels are not like for like.
Utilisation series break. Different trade data providers give different levels for the same year, and levels have been restated between one annual report and the next, so no continuous multi-year industry utilisation series can be constructed from these filings.
Figures are in renminbi, the group's reporting currency and the currency of the underlying filings, except where a source states another unit — natural rubber prices in US dollars per tonne, project investment in US dollars, and Chinese national export statistics in renminbi as published. The company's shares trade in Hong Kong dollars.
The company's own record against these forces is set out in Competition and History; this page covers only the arena they are contested in.
The contested ground
Prinx Chengshan sells tyres in over 160 countries through three channels — domestic distributors, international distributors, and direct supply to vehicle manufacturers — and manufactures from two bases, Shandong and Thailand, with a third under construction in Malaysia [1] [2]. Every rival in this tab does the same thing: five listed Chinese tyremakers, all reporting in renminbi, all selling all-steel radial (truck and bus) and semi-steel radial (passenger) tyres into the same export replacement channels, and all building capacity outside China. The overlap is close enough that the comparison is fair on scale, growth, margin and capacity; it is not fair on product mix, and the tab says where.
Management's own framing names the pressure precisely. The FY2025 report describes competition against "numerous global tire manufacturers while also facing challenges from Chinese tire enterprises," which "have accelerated their diversified production footprint by establishing new smart manufacturing bases in Southeast Asia (such as Thailand, Vietnam, Cambodia) and Eastern Europe (such as Hungary, Serbia)" [3]. That paragraph is new in recent vintage: it first appears as item (4) of the FY2024 risk section, which closes on the challenge of intensified competition in the regional market [4] and is repeated word for word in FY2025. The FY2023 risk section, by contrast, runs six items from macro environment through climate change and contains no competition item at all [5].
The evidence base for what follows: five annual reports for Prinx Chengshan (FY2021–FY2025), the 2018 global-offering prospectus (the only document in the corpus carrying third-party market-share and contract-term detail), and each rival's own FY2024 and FY2025 annual reports plus, for Sailun, four investor-meeting records. Arena structure and cycle belong to Industry; the raw peer source shelf is Competitors; company call commentary is in Calls.
All figures in this tab are renminbi, the reporting currency of Prinx Chengshan and of all five rivals. Prinx Chengshan's shares trade in Hong Kong dollars; no filing figure below is a Hong Kong dollar amount.
Segment overlap
The staged peer screen named six Chinese tyremakers [6]. Five of them have annual reports in this corpus and all five are confirmed from their own filings as radial tyre manufacturers competing for the same export replacement shelf. The sixth, Zhongce Rubber Group (603049), has no indexed filings in this run, so it appears nowhere in the numbers below despite being China's largest producer by volume; that is a hole in the record, not a judgment that it does not compete.
Sources: Prinx Chengshan FY2025 Annual Report, production capacity and distributor channel revenue disclosure [7] [8]; Sailun FY2025 Annual Report, overseas layout [9]; Linglong FY2025 Annual Report, capacity table [10]; Triangle FY2025 Annual Report [11]; Guizhou Tyre FY2025 Annual Report, overseas base disclosure [12]; Jiangsu General Science FY2025 Annual Report, capacity table [13].
Two of the five differ enough in mix to make like-for-like margin comparison unsafe. Guizhou Tyre earns most of its revenue from off-the-road and heavy commercial tyres: it sold 9.65 million tyres in 2025 for RMB10.87 billion of tyre revenue [14] [15]. Linglong runs the opposite way — 91.3 million tyres for RMB24.47 billion, overwhelmingly passenger [16]. Prinx Chengshan sits between them.
Rival scale and profit, FY2022 to FY2025
Sources: Sailun FY2025 and FY2024 Annual Reports, key accounting data [17] [18]; Linglong [19] [20]; Triangle [21] [22]; Guizhou Tyre [23] [24]; Jiangsu General Science [25] [26]; Prinx Chengshan FY2025 Annual Report, revenue recorded for the year [27].
Over the four years, the set separates. Sailun added RMB14.89 billion of revenue and Jiangsu General Science more than doubled from a small base; Prinx Chengshan grew 44.8%; Triangle went sideways, from RMB9.22 billion in 2022 to RMB9.82 billion in 2025, with two consecutive declining years after a 2023 peak of RMB10.42 billion; Guizhou Tyre grew 29.7% but almost stalled in 2025 at 2.4%.
FY2025 was the year profit broke from revenue for most of the group.
Sources: as for the revenue chart above — Sailun [28]; Linglong [29]; Triangle [30]; Guizhou Tyre [31]; Jiangsu General Science [32]; Prinx Chengshan, profit attributable to owners of the Company [33].
Five of the six earned less in 2025 than in 2024 while five of the six sold more. Sailun's profit fell 13.3% on 15.7% revenue growth; Linglong's fell 21.9% on 11.7% growth; Jiangsu General Science lost 46.1% of its profit while revenue rose 22.1%; Prinx Chengshan's fell 17.1% on 7.6% growth [34]. Guizhou Tyre was the exception, up 0.7%. That pattern — volume up, unit economics down, across five independently audited filers in the same year — is the single most consistent fact in the peer record.
Sources: peer gross margins and geographic splits are the tyre or main-business segment figures each company reports under PRC accounting standards — Sailun [35], Linglong [36], Guizhou Tyre [37], Triangle [38], Jiangsu General Science [39]; Prinx Chengshan's is the consolidated IFRS gross margin [40] with the geographic share derived from its segment note [41]. Prior-year peer margins are derived from the year-on-year percentage-point movements disclosed alongside each FY2025 figure.
The accounting bases differ, and the difference matters: Prinx Chengshan's 18.1% is a consolidated IFRS gross margin on all revenue [42], while the peer figures are PRC-GAAP main-business margins that exclude some costs Prinx Chengshan carries above the gross line. Read the levels as a rough ranking and the year-on-year direction as the reliable signal. On direction, four of six compressed, Prinx Chengshan by 3.1 percentage points [43], Linglong by 4.95 and Sailun by 3.08 [44] [45]. Triangle went the other way, adding 2.11 points on falling revenue [46].
Margin by geography
Every rival that splits gross margin by geography earns more abroad than at home. Prinx Chengshan does not publish that split, so its bar is absent from this comparison.
Sources: Sailun [47]; Linglong [48]; Triangle [49]; Guizhou Tyre [50]; Jiangsu General Science [51].
The gap runs from 5.0 points at Sailun to 18.0 points at Jiangsu General Science, which reported a negative domestic gross margin of 2.67% on RMB1.15 billion of PRC sales in 2025 — selling at home below the cost of goods, on revenue down 4.7% year on year, while its export gross margin held at 15.31% on revenue up 28.7% [52]. Prinx Chengshan's domestic distributor revenue fell 10.6% to RMB2,078.9 million in 2025 while international distributor revenue rose 3.4% to RMB7,796.6 million [53]; whether its own domestic margin behaves like the peers' is not disclosed.
Offshore capacity
The capacity being built outside China is where the rival record is most quantitative, and where the scale spread is widest.
Sources: Prinx Chengshan Thailand capacity [54] and Malaysia plan [55]; Sailun overseas planned capacity [56]; Linglong plant-by-plant design capacity [57]; Jiangsu General Science plant-by-plant design capacity [58]. Guizhou Tyre discloses its Vietnam base and a planned Moroccan second base without per-line capacity for the existing plant [59]; Triangle discloses no offshore plant.
Sailun states in its FY2025 report that it has planned overseas capacity of 11.1 million all-steel radial tyres, 62 million semi-steel radial tyres and 110,000 tonnes of off-the-road tyres across five countries, and describes itself as "the Chinese tyre enterprise with the largest overseas capacity" (目前海外布局产能规模最大的中国轮胎企业) [60]. Prinx Chengshan's operating offshore capacity is 12 million sets in Thailand, with 6.6 million more planned in Malaysia at a stated investment of USD299 million, construction having begun in the third quarter of 2025 [61] [62].
Movement in 2025 alone: Linglong added 7.75 million semi-steel and 1.0 million all-steel sets of achieved capacity in Serbia [63]; Jiangsu General Science added 5 million semi-steel sets in Thailand and 0.5 million all-steel plus 2 million semi-steel in Cambodia while cutting domestic capacity by 1.2 million all-steel and 3 million semi-steel sets [64]; Sailun announced a 1.65 million all-steel expansion in Cambodia in January 2025, first output from its Indonesian and Mexican bases in May, and in August an Egyptian project for 3 million semi-steel and 600,000 all-steel tyres a year, expanded in April 2026 to a plant that would run 9 million semi-steel and 1.65 million all-steel tyres a year once complete [65]. Guizhou Tyre, which runs a "Guiyang in China, Dong Thap in Vietnam" dual-base strategy, states it is "actively preparing a second overseas production base, planning to invest in Morocco in an intelligent manufacturing project with an annual capacity of 6 million semi-steel radial tyres" (公司正积极筹建第二个海外生产基地,计划在摩洛哥投资建设年产600万条半钢子午线轮胎的智能制造项目) [66]. Jiangsu General Science publishes a target of five production bases, five research centres, 500 strategic channel distributors, 5,000 core stores and capacity above 50 million tyres — roughly double the 25.6 million it sold in 2025 [67] [68].
Prinx Chengshan's own utilisation ran tight in 2025 — Shandong at 93.8% all-steel and 92.6% semi-steel, Thailand at 80.6% and 92.5% [69] — against Linglong's Thai plants at 80.6% and 83.7% and its group design capacity of 125.6 million tyres [70]. Prinx Chengshan's total across both bases is 30.9 million sets.
Price per tyre
Volumes and tyre revenue are disclosed by all six for 2025, which makes average realised price per tyre computable on a common basis. It is a mix indicator, not a price-competitiveness score: a truck tyre and a passenger tyre sell for very different money.
Source: derived from disclosed tyre revenue divided by disclosed tyres sold — Sailun 81.13 million tyres on RMB36,403 million [71]; Linglong 91.35 million on RMB24,475 million [72]; Jiangsu General Science 25.59 million on RMB8,447 million [73]; Triangle 22.61 million on RMB9,759 million [74] [75]; Guizhou Tyre 9.65 million on RMB10,870 million [76] [77]; Prinx Chengshan 29.3 million on RMB11,807 million [78].
Prinx Chengshan's own blend of RMB403 decomposes into roughly RMB794 per all-steel tyre and RMB242 per semi-steel tyre, using the 56.5% and 41.8% revenue shares it discloses against 8.4 million and 20.4 million sets sold [79]. That spread explains most of the difference between it and Linglong, and all of the difference between it and Guizhou Tyre.
Across its own five years the blended figure has moved on a path of its own.
Source: derived from disclosed sales volumes and revenue, FY2021–FY2025 Annual Reports [80] [81] [82] [83] [84]; gross margins as reported [85] [86] [87] [88] [89].
Revenue per tyre peaked at RMB441 in 2022 and has run 8% to 11% below that ever since, with the 2023–2024 fall coinciding with the shift of volume towards semi-steel: semi-steel sales went from 11.5 million sets in 2022 to 20.4 million in 2025 while all-steel went from 6.7 million to 8.4 million [90] [91]. Gross margin and price per tyre moved together in 2022 and 2025 and apart in 2023, when margin rose 7.0 points as price per tyre fell — the company attributed that year's expansion to volume and falling raw material prices [92], and the 2025 contraction to raw material prices and United States tariff policy [93].
Disclosed share, and the years since
The only third-party market-share measurement of Prinx Chengshan anywhere in this corpus is in the 2018 prospectus, prepared by Frost and Sullivan on 2017 data with rivals anonymised. It is eight years stale, and there is no later measurement in any filing.
Source: 2018 global-offering prospectus, Industry Overview, Frost and Sullivan and China Customs data for 2017 [94]; the export ranking tables and their shares are on the following page [95].
The same section put the top ten domestic players at a combined 26.6% of PRC all-steel radial sales volume and 21.0% of the replacement market, describing a sector where "the majority of domestic players don't have considerable scales and thus they mainly compete in highly-competitive medium- and low-end tires segment" [96]. Triangle's FY2025 report says essentially the same thing eight years later: Chinese tyre companies are "numerous but individually small in scale, with insufficient industry concentration and pronounced tiering" (企业数量众多但个体规模偏小,行业集中度不足,梯队分化明显) [97].
What has changed and is measurable sits in three places. First, ranking: Sailun reports itself tenth worldwide and second in China on 2025 trade-press tables [98], Triangle eighth in China by 2024 revenue and twenty-fifth globally [99]. Prinx Chengshan states no ranking in any of its five annual reports.
Second, customer concentration, which fell by half and then stopped falling.
Sources: FY2021–FY2025 Annual Reports, Report of the Directors, top five customers and single largest customer [100] [101] [102] [103] [104].
The break falls between 2022 and 2023: largest customer from 9.1% to 3.6%, top five from 17.8% to 12.2% [105] [106]. At the 2018 listing the largest customer was Cooper Tire, taking 21.0%, 20.5% and 14.8% of revenue in 2015, 2016 and 2017 under two offtake agreements expiring 30 June 2019 [107]. No customer has reached even 4% of revenue since 2022. The filings do not name the customer whose exit produced the 2023 step down.
One rival does quantify what happened in the channel Prinx Chengshan calls home. Triangle reports that its PRC replacement volume fell 18% in 2025, passenger-car replacement volume 22%, and international volume 6%, while its domestic original-equipment volume grew 7.8% [108]. Prinx Chengshan does not publish volumes by channel, so its own domestic replacement trajectory can only be read through the 10.6% revenue decline in that channel [109].
Third, channel mix, which is where the actual sales fight shows up; the five-year channel series is in Business.
Domestic distributor revenue is the one line that has gone nowhere in five years: RMB2,043 million in 2021, RMB2,079 million in 2025, having fallen in three of those years [110] [111]. This happened while the company was adding channel infrastructure at home: the commercial-vehicle "lighthouse e-station" network grew to 8,078 stores from over 7,149 a year earlier, and 126 passenger-tyre distributors carried 25,389 registered retail stores [112]. Direct sales to vehicle manufacturers rose 73.9% in 2025 to RMB1,926 million, the fastest-moving channel, on new-energy heavy-truck and export-model programmes and mass supply to Great Wall Motor and SAIC Motor Passenger Vehicle [113]. Internationally the company added 56 distributors and entered five new markets in 2025 [114].
By destination, the Americas and the domestic market together account for two thirds of revenue and have alternated as the largest.
Sources: FY2023, FY2024 and FY2025 Annual Reports, segment information notes [115] [116] [117].
Trade-duty exposure
Duty rates are firm-specific in this industry, which makes them one of the few places where a rival's cost position and this company's are measured separately by the same authority.
The dated firm-specific rate record — the United States and South African rates assigned to this group, and the European investigation dates — is in History.
Prinx Chengshan attributes the fourth-quarter slowdown in Chinese semi-steel exports to that investigation [118]. Jiangsu General Science frames the same mechanism from the other side, listing among its risks that alongside the United States' additional reciprocal and Section 232 tariffs and the European Union's investigation, "South Africa, Egypt, Brazil and other countries have also successively introduced tyre-related trade restriction measures" (南非、埃及、巴西等国也陆续出台轮胎相关的贸易限制措施) — the same countries in which Chinese tyremakers have been siting offshore capacity [119].
What rivals say
Each of the five describes the same arena, and the wording is worth reading because it comes from filings prepared independently for a different exchange and regulator. All five file in Chinese; quotations below are translations, with the original wording given where a phrase is load-bearing.
Sailun, on the reshaping of the field: leading overseas tyremakers are "gradually contracting strategically, divesting low-gross-margin business segments," while Chinese tyre companies, "driven by white-hot domestic market competition and increasingly complex overseas trade conditions" (受国内市场竞争白热化、海外贸易形势复杂化等因素驱动), keep pushing global capacity build-out and localised operation [120].
Guizhou Tyre, in its risk section, is blunter still: "domestic tyre industry capacity is structurally in surplus, competition is white-hot; the international high-end market is still dominated by industry giants" (国内轮胎行业产能结构性过剩,竞争白热化;国际高端市场仍由行业巨头主导), and "technology iteration and tightening environmental policy are accelerating the industry shake-out" [121], with survival pressure rising sharply for small and mid-sized enterprises while leading firms keep investing in overseas capacity expansion to consolidate their advantage [122].
Jiangsu General Science names the mechanism that shows up in its own negative domestic margin: structural overcapacity and rising manufacturing cost "bring price involution of homogeneous products" (带来同质化产品的价格内卷) [123].
Triangle attributes its own 2025 decline directly to the two markets Prinx Chengshan also sells into: production and sales volumes fell slightly year on year "affected by insufficient domestic replacement market demand and intensified international market competition" (受国内替换市场需求不足、国际市场竞争加剧等因素影响), with capacity utilisation about 90% and 22.61 million tyres sold [124].
On pricing, the most recent rival statement in the corpus is Sailun's investor meeting of 8 May 2026, where management said that after flexibly adjusting procurement and weighing production cost against demand, "the company has already raised prices on its products" (目前公司已对产品进行提价) [125]. A year earlier, on 21 May 2025, the same forum described capacity coming through in sequence: beyond the continuing ramp of Cambodian semi-steel, "the Cambodian all-steel expansion, the Indonesian plant and the Mexican plant are also expected to release capacity progressively" [126].
Prinx Chengshan's own reading of the same field, in its FY2025 industry section: reliance of the United States and Europe on imported tyres "continues to rise," Southeast Asia is "gradually replacing local production capacity in Europe, the United States, South Korea, and Japan to become a key source of supply," and Chinese producers' share in emerging and Western markets "continue to expand" [127]. The FY2024 report quantified the shift: overseas capacity as a proportion of China's top ten tyre companies rose from 18% in 2020 to 35% in 2023 [128].
Switching terms
The prospectus is the only document in the corpus that sets out contract terms, and what it describes is a low-friction channel: annual agreements, no minimum purchase obligation, cash before delivery, and distributor-set retail prices.
Source: 2018 global-offering prospectus, Business — Distribution Agreements [129]; Pricing and Payment Terms, where credit periods of no more than 60 days are granted [130]; the four-year warranty against defects in materials and workmanship [131]; the sales-area penalty and sub-distributor provisions are set out under Management of Distributors [132].
Nothing in those terms locks a distributor in for more than twelve months, and the prospectus records what that meant in practice: 82, 97, 140 and 74 distributors newly engaged in 2015, 2016, 2017 and the first quarter of 2018, against 66, 59, 75 and 26 terminated, mostly for missing sales targets or territory development expectations, with "top-ten distributors remained relatively stable" and no obligation to take back terminated distributors' unsold stock [133]. Gross churn of that size against a stable top tier is the pattern the disclosed terms would predict. Whether it still holds is unknown: no annual report since 2018 discloses distributor additions or terminations.
Two heavier contractual structures also sit in the record. The Cooper offtake agreements ran from 30 November 2014 to 30 June 2019 with annual minimum purchase volumes and monetary penalties on shortfall — penalties Cooper never triggered in 2014 through 2017 — and imposed sales restrictions barring Prinx Chengshan from selling semi-steel tyres into Canada, the United States and Mexico and all-steel tyres into North America until those restrictions lifted at the end of 2017 [134] [135]. Those were the only minimum-volume commitments the company has disclosed, and they are long expired.
The second is internal to the ownership structure. Because the controlling shareholder retained a Malaysian tyre business that "may constitute direct competition with the Group," the Deed of Non-competition of 10 September 2018 gave Prinx Chengshan a call option and right of first refusal over Chengshan (Malaysia), and an undertaking that the Group would be appointed its "sole and exclusive distributor" at cost-based pricing if that business began operating first [136]. The independent non-executive directors confirmed compliance with that deed for 2025 [137]. Separately, the Malaysian base the company is now building is its own, in Kedah Rubber City [138].
On the customer side, the same low-friction picture holds where it is disclosed: private-label framework agreements set estimated volumes with prices renegotiated quarterly against raw material costs, and either party may terminate on written notice if the other fails to deliver or purchase 80% of the annual volume [139]. Original-equipment supply works the other way, on qualification rather than contract: the prospectus notes that entering a vehicle manufacturer's supply system "requires an assessment period lasting many years" [140], and the 218 customer-specific products developed during the track record period [141], along with current programmes for Great Wall Motor, SAIC Motor Passenger Vehicle, Chery New Energy and BAIC, are project-level rather than volume-committed [142]. The domestic logistics fleet relationships — JD Logistics, KUAYUE-EXPRESS, Deppon and Dishangtie, where the company describes itself as a high-share supplier since 2022 — carry no disclosed term, duration or exclusivity [143].
Gaps in the record
Four absences shape what a reader can and cannot conclude from the above.
No current market share. The last third-party measurement of Prinx Chengshan's share is 2017 [144]. The FY2025 report asserts a domestic commercial all-steel replacement "market penetration rate that ranks among the highest in the industry" without a number or source [145], and its brand-value citation of RMB3.940 billion for 2025 measures brand, not share [146].
No geographic margin split for this company, where all five rivals provide one. No current distributor churn data, where the prospectus provided four periods of it. And no filings at all for Zhongce Rubber Group, the largest Chinese producer by volume and a named member of the peer screen [147]. Triangle's four indexed investor-meeting records contain no extractable text, so its management commentary here rests on the annual reports alone.
The record and its breaks
Prinx Chengshan dates itself to the Rongcheng Rubber Factory of 1976, and the FY2025 chairman's statement treats 2026 as the group's fiftieth year [1]. The corporate entity is much younger: the Cayman holding company was incorporated on 22 May 2015, and the shares have traded on the Main Board of the Hong Kong Stock Exchange since 9 October 2018 [2].
Four breaks organise everything after that. The first is the 2014–2015 buy-back of control from Cooper Tire and the pre-IPO restructuring that created the listed group. The second is the 2018 listing, which arrived in the same weeks as the first round of United States tariffs on Chinese tyres. The third is the Thailand production base, built between 2019 and 2022, which changed where the company manufactures, where it sells, and how much cash it consumed on the way. The fourth is the capital-allocation reset that began in FY2022, when the announced Anhui plant was suspended, and ended in 2025, when the group committed to a Malaysian base and a domestic off-the-road tyre plant instead.
This tab is a record, not an argument. Who controls and runs the company today sits in People; the named-rival and share record sits in Competition.
Operating roots
HKEX listing
FY2025 revenue (RMB m)
FY2025 tyres sold (m)
Sources: the 1976 Rongcheng Rubber Factory roots, and the tires sold and revenue for FY2025, in the FY2025 Statement of the Chairman [3] [4]; listing date from the FY2025 notes [5].
What the corpus does and does not cover. The primary record available here runs from the 2018 global offering prospectus through the FY2025 annual report signed on 30 March 2026, plus a news index to July 2026. The FY2018, FY2019 and FY2020 annual reports are not in the corpus, so the disclosed utilisation of the listing proceeds and the first two years of Thailand construction spending cannot be sourced to a filing page here. Only two earnings-call transcripts exist in the record — the FY2020 call of 31 March 2021 and the H1 2021 call of 31 August 2021 — and both are summarised on the Calls tab. Every period below is either accounted for or marked unavailable.
The arc in dated beats
| Date | Event | Source |
|---|---|---|
| March 1990 | First domestic radial tyre production line in the PRC | [6] |
| December 2003 | Rongcheng Rubber Factory restructured into Chengshan Group by management and employee buy-out | [7] |
| September 2004 | Becomes the third-largest tyre manufacturer in the PRC | [8] |
| December 2005 | Cooper Chengshan joint venture established with Cooper Tire, initially 51 per cent Cooper-owned | [9] |
| November 2014 | Cooper sells its 65 per cent stake to Prairie Investment for US$274.8 million; the business is renamed Prinx Chengshan (Shandong) Tire | [10] |
| May 2015 | Cayman holding company incorporated | [11] |
| September 2015 | Remaining 35 per cent of the Shandong operating company acquired from Chengshan Group for US$77.0 million | [12] |
| October 2015 | Pre-IPO round completes: Chengshan Group subscribes about US$193.2 million of ordinary shares, Sinotruk Capital US$40.0 million for 12.68 per cent in preferred shares | [13] |
| September 2018 | Deed of Non-Competition signed; the Malaysia Production Base held by Chengshan Group is excluded from the group, with a call option and right of first refusal granted to it | [14] |
| 24 September 2018 | United States imposes an additional 10 per cent tariff covering all tyres the group exported to the United States; the prospectus lists constructing or acquiring an overseas base as a mitigation | [15] |
| 9 October 2018 | Listing on the Main Board of the Hong Kong Stock Exchange; estimated net proceeds of HK$837.9 million, or RMB729.5 million, at the mid-point price | [16] [17] |
| 15 February 2019 | United States anti-dumping and countervailing order on Chinese truck and bus tyres; combined deposit rate of 42.16 per cent | [18] |
| 2019 | Construction of the Thailand base begins | [19] |
| 2020 | Thailand phase I plants completed; Shandong expansion and Thailand phase II approved | [20] |
| 10 June 2021 | Company renamed Prinx Chengshan Holdings Limited; new share certificates issued | [21] |
| 19 July 2021 | United States anti-dumping order on Thai passenger and light-truck tyres; an average 17.06 per cent rate applies to the Thai base | [22] |
| 31 August 2021 | Board approves phase I of the Anhui base, about RMB3.0 billion, alongside a 51/49 capital-increase structure with Hefei Dongcheng Industrial Investment | [23] |
| Q1 2022 | Thailand phase II and the Shandong expansion both reach designed capacity | [24] |
| FY2022 | Anhui suspended; no definitive investment or construction agreements had been signed | [25] |
| 31 December 2022 | Market capitalisation of about RMB3,457 million falls below net assets of about RMB4,432 million, triggering an impairment test; no asset or cash-generating unit impaired | [26] |
| 31 August 2023 | Board approves the Shandong semi-steel capacity optimisation, about RMB120.0 million, and Thailand phase III, about RMB200.8 million | [27] |
| Q2 and Q4 2024 | Both 2023 projects complete, on the timetable given at approval | [28] |
| 17 December 2024 | United States recall covering more than 500,000 Fortune and Prinx branded tyres | [29] |
| 2025 | Malaysia base and the domestic off-the-road tyre project disclosed in the FY2024 annual report as future plans | [30] |
| 4 August 2025 | Thai authorities order the Chon Buri plant to halt production over waste-treatment and emissions acceptance | [31] [32] |
| 8 August to 4 September 2025 | Trial restart permitted for environmental equipment testing; rectification completed 4 September | [33] |
| 5 September 2025 | Full resumption of normal production approved | [34] |
| Q3 2025 | Malaysia base construction commences; groundbreaking ceremony held 18 November at Kedah Rubber City | [35] [36] |
| 19 January 2026 | First 30.00R51 giant off-the-road tyre rolls off the line | [37] |
| 1 August 2026 | Che Baozhen steps down as chief executive, remaining an executive director for global strategy; Jiang Xizhou takes a newly created president role | [38] |
What the record produced
Revenue has risen in every year the corpus covers. Profit has not: FY2021 and FY2022 sit in a trough between the pre-Thailand years and the FY2023–FY2024 peak, and FY2025 gave back part of that peak.
Sources: the revenue and profit for the year rows of the FY2021 five-year summary, FY2017 to FY2021 [39]; the FY2025 five-year summary, FY2021 to FY2025 [40]; FY2016 revenue as reported in the 2018 global offering prospectus [41].
Gross margin traces the same shape more sharply. It fell from 22.3 per cent in FY2020 to 13.8 per cent in FY2021, recovered to 21.3 per cent in FY2023, and fell again to 18.1 per cent in FY2025.
Sources: the gross profit margin and net profit margin rows of the FY2021 Key Financial Indicators [42]; and of the FY2025 Key Financial Indicators [43].
Management said versus did
The record contains one quantified multi-year revenue target, a set of project-level capacity and timing commitments, a dividend policy, and an investment-return hurdle. The table below scores each against the outcome the filings later reported, and names the measurement basis where it matters.
| Promise or target | Made | Basis | Measured at | Outcome |
|---|---|---|---|---|
| Annual dividend of no less than 20 per cent of distributable net profit attributable to equity shareholders | 2018 prospectus [44] | Declared dividends over profit attributable | FY2021 to FY2025 | Dividends declared every year. Converting declared per-share dividends at year-end rates and dividing by profit attributable, the payout was about 38, 29, 17, 30 and 26 per cent for FY2021 to FY2025; the FY2023 figure sits below the 20 per cent floor on that basis. The policy's own denominator, distributable net profit, is not disclosed as a flow — the reports disclose only a stock of distributable reserves, RMB2,220.7 million at end-2023 [45] |
| Invest only in projects with an internal rate of return of no less than 10 per cent and a payback period of no more than 10 years | 2018 prospectus [46] | Project-level returns | FY2021 to FY2025 | No project-level internal rate of return or realised payback has been disclosed in any annual report in the corpus. The only later payback figure on the record came on the August 2021 call, where the chief financial officer put Anhui phase I at about ten years — the outer edge of the stated hurdle |
| Expand all-steel radial capacity by 2.0 million units by 2021 in two phases costing about RMB496.5 million and RMB650.7 million, with paybacks of 2.5 and 3.5 years | 2018 prospectus [47] [48] | Rongcheng all-steel capacity | FY2021 to FY2023 | Shandong all-steel capacity reached 7.4 million units, against 4.7 million at the prospectus date [49] [50]. The capacity was delivered and exceeded, though under a differently structured programme; the 2.5 and 3.5 year paybacks were never reported against |
| Expand semi-steel radial capacity by 2.25 million units by 2021 at a cost of about RMB460.9 million, payback 4.8 years | 2018 prospectus [51] | Rongcheng semi-steel capacity | FY2021 to FY2024 | Shandong semi-steel capacity reached 11.2 million units by FY2023 and 11.53 million after the 2024 optimisation, against 6.5 million at the prospectus date [52] [53]. Delivered; payback never reported against |
| Group revenue of RMB16.0 billion in 2025, described as a stage goal of the medium and long-term plan | FY2021 chairman's statement [54] | Group revenue, FY2025 | FY2025 | Missed. FY2025 revenue was RMB11,806.8 million, about 74 per cent of the target [55]. The target appears once in the corpus and is not restated, revised or referenced in the FY2022 to FY2025 annual reports |
| Thailand phase II, 1.2 million all-steel and 4.0 million semi-steel units, to reach designed capacity in Q1 2022 | FY2021 annual report [56] | Thailand capacity | Q1 2022 | Met. Thailand stood at 2.0 million all-steel and 8.0 million semi-steel units at end-2022 [57] |
| Shandong expansion, 1.05 million all-steel and 2.8 million semi-steel units for about RMB666.0 million, to reach designed capacity in Q1 2022 | FY2021 annual report [58] | Shandong capacity | Q1 2022 | Met [59] |
| Anhui phase I, 800,000 all-steel and 5 million semi-steel units, about RMB3.0 billion, funded by shareholder contributions and a syndicated loan | Board resolution 31 August 2021, FY2021 annual report [60] | Construction start and output | End-2022 target on the August 2021 call | Not delivered. The FY2022 report states the group decided to suspend implementation and that no definitive agreements had been entered into [61]. Anhui does not reappear in the investments or future-plans sections of the FY2023, FY2024 or FY2025 reports |
| Shandong semi-steel optimisation to 11.53 million units for about RMB120.0 million, and Thailand phase III of 2 million semi-steel units for about RMB200.8 million, both to reach designed capacity in H2 2024 | Board resolutions 31 August 2023 [62] | Project completion | FY2024 | Met. Shandong completed in Q2 2024 and Thailand phase III in Q4 2024 [63] |
| Malaysia base to commence in Q2 2025 with trial production in H2 2026, total investment US$380 million | FY2024 annual report [64] [65] | Start date, cost, trial date | FY2025 | Partly. Construction commenced in Q3 2025, not Q2; trial production is now expected in Q4 2026; and the stated total investment is now US$299 million on the same capacity plan [66] |
| Off-the-road tyre project, construction from Q2 2025, designed capacity by 2029, output value about RMB1.0 billion | FY2024 annual report [67] | Trial production | FY2025 and January 2026 | Ahead of the disclosed path on the first milestone: trial production began in Q4 2025 and the first giant tyre rolled off the line on 19 January 2026 [68] |
Two commitments made on the FY2020 call of 31 March 2021 can now be scored against the filings. The chief financial officer forecast double-digit group revenue growth for 2021; revenue rose 20.0 per cent to RMB7,537.2 million [69]. He also put FY2021 Thailand revenue at RMB1.8 billion to RMB2.0 billion; the FY2022 report's first segment disclosure shows overseas segment revenue of RMB1,810.9 million for FY2021, at the bottom of that range [70]. The undertaking that Thailand profit in 2021 would absorb its RMB50 million 2020 loss cannot be scored: no Thailand-level profit figure appears in the annual reports in this corpus.
Sources: FY2021 Annual Report, Chairman's Statement, for the RMB16.0 billion 2025 stage goal [71]; the FY2025 five-year summary, for the reported revenue outcome [72].
Capital allocation
Everything the group has built since listing has been built, not bought. The corpus records no acquisition, no disposal of a subsidiary, associate or joint venture, and no purchase, sale or redemption of listed securities in any year from FY2021 through FY2025 [73] [74]. Cash went to plants and to dividends.
| Approved | Project | Stated cost | Stated objective | Disclosed outcome |
|---|---|---|---|---|
| 2018 prospectus | Rongcheng all-steel expansion, two phases | RMB496.5 million and RMB650.7 million | Add 2.0 million units by 2021; paybacks 2.5 and 3.5 years | Capacity delivered; no payback or return reported [75] |
| 2018 prospectus | Rongcheng semi-steel expansion | RMB460.9 million | Add 2.25 million units by 2021; payback 4.8 years | Capacity delivered; no payback or return reported [76] |
| H2 2020 | Thailand phase II, all-steel | RMB541.0 million | 1.2 million all-steel units per year | Designed capacity reached Q1 2022 [77] |
| H2 2020 | Shandong expansion | RMB666.0 million | 1.05 million all-steel and 2.8 million semi-steel units | Designed capacity reached Q1 2022 [78] |
| H1 2021 | Thailand phase II, semi-steel | RMB896.0 million | 4.0 million semi-steel units per year | Designed capacity reached Q1 2022 [79] |
| 31 August 2021 | Anhui phase I | About RMB3,000.0 million; 2022 budget of RMB1,748 million | 800,000 all-steel and 5 million semi-steel units; second domestic base | Suspended in FY2022; no definitive agreements signed; not mentioned again [80] [81] |
| 31 August 2023 | Shandong semi-steel optimisation | RMB120.0 million | Raise semi-steel capacity to 11.53 million units | Completed Q2 2024 [82] |
| 31 August 2023 | Thailand phase III | RMB200.8 million | 2 million semi-steel units per year | Completed Q4 2024 [83] |
| 2025 | Malaysia base, Kedah Rubber City | US$380 million at disclosure, restated to US$299 million, about RMB2.1 billion | 6 million semi-steel and 600,000 all-steel units; output value about US$270 million at full capacity | Under construction; trial production expected Q4 2026 [84] |
| 2025 | Shandong off-the-road tyre project | RMB1.17 billion in the chairman's statement, RMB1.11 billion in the same year's management discussion | Fill the domestic high-end engineering tyre gap; output value about RMB1.0 billion | Trial production Q4 2025; first giant tyre January 2026 [85] [86] [87] |
The spending pattern that results is a three-year build, a three-year pause, and the start of a second build. Capital commitments outstanding at year-end tell the same story compressed: RMB70.0 million at end-2023, RMB77.8 million at end-2024, then RMB745.3 million at end-2025, which the report attributes to Malaysia and the off-the-road project [88].
Sources: capital expenditure from reported cash-flow statements; total dividend distribution per the management discussion in each year, FY2021 [89], FY2022 [90], FY2023 [91], FY2024 [92] and FY2025 [93].
Dividends are declared in Hong Kong dollars. The per-share record is flat for two years, then a step up, then a partial step back: an interim dividend appeared for the first time in FY2024 and did not recur in FY2025, so declared distributions per share fell from HK$0.65 to HK$0.50 even though the FY2025 statement presents the final dividend as sharing the fruits of development [94] [95].
Sources: the FY2024 interim dividend per ordinary share [96]; the FY2025 final dividend per ordinary share [97]; earlier years from the corresponding Report of the Directors. Dividends are declared in Hong Kong dollars and are shown as declared.
Where the growth came from
The FY2022 report introduced two reportable segments defined by operating location, domestic and overseas. On that basis the Thailand base went from 24 per cent of revenue in FY2021 to 38 per cent in FY2025, and in FY2022 and FY2024 it produced more gross profit than the far larger domestic segment.
Sources: the segment revenue rows of the FY2022 Segment Information note, for FY2021 and FY2022 [98]; FY2023 [99], FY2024 [100] and FY2025 [101] annual reports.
Sources: segment results as reported in the FY2022 [102], FY2023 [103], FY2024 [104] and FY2025 [105] annual reports.
Sales volume follows the capacity that was actually built. The group sold 18.61 million tyres in FY2021, 18.53 million in FY2022, then 25.03 million, 27.97 million and 29.29 million as Thailand phases II and III and the Shandong expansion came on stream.
Sources: total sales volume tables in the FY2021 [106], FY2022 [107], FY2023 [108], FY2024 [109] and FY2025 [110] annual reports.
Explanation drift
Four accounts changed materially over the period. Each is quoted at its stages, with the date and source.
Margin and cost pass-through, 2021. On the FY2020 call of 31 March 2021 the chief financial officer told analysts that over an annual cycle gross margin would stay at a stable level. On the H1 2021 call of 31 August he said that improving gross margin in the short term was very difficult, and described a price-transmission gap in the industry that remained under heavy pressure. The FY2021 annual report then reported gross margin of 13.8 per cent against 22.3 per cent in FY2020 [111]. Both call quotes and their context are on the Calls tab; the transcripts themselves are not filings in this corpus and carry no page link.
The second domestic plant. In FY2021 Anhui was presented as an approved investment with a registered subsidiary, a named local partner, a RMB3.0 billion phase I and a RMB1.748 billion budget line for 2022 [112]. In FY2022 the same section states that, based on forecasts of the economic situation and the company's capacity utilisation rate, the group decided to suspend the implementation of the project, and that no definitive agreements had been entered into [113]. From FY2023 the project is absent from the investments and future-plans sections altogether; the Anhui subsidiary remains in the group's subsidiary listings. No write-off, cost or recovery relating to the suspension is disclosed in the corpus.
The cost of the Malaysian base. The FY2024 chairman's statement and management discussion both put the total investment at approximately US$380 million, with commencement in Q2 2025 and trial production in H2 2026 [114] [115]. The FY2025 report describes the same capacity plan, the same US$270 million output value at full capacity, and a total investment of US$299 million, with construction commenced in Q3 2025 and trial production expected in Q4 2026 [116]. No reason for the 21 per cent reduction is given.
The Thai shutdown. The FY2025 management discussion states that Prinx Thailand received a notice of temporary suspension of production from the Industrial Estate Authority of Thailand in August 2025 over the acceptance of waste treatment and emissions, that rectification was completed on 4 September and full resumption approved on 5 September, and that the matter had no material adverse effect on operations or financial position [117]. The chairman's statement covers the same episode as a compliance upgrade that ended in an environmental certification [118]. Contemporaneous trade coverage sized the affected plant at roughly 38 per cent of tyre revenue at the time of the order [119]. Thai all-steel utilisation fell from 87.1 per cent in FY2024 to 80.6 per cent in FY2025, and Thai semi-steel from 97.2 to 92.5 per cent [120]. No quantified revenue or profit impact from the shutdown is disclosed.
The scope of the non-competition undertaking. The prospectus describes the restricted business as tyre manufacturing and sale in the PRC and overseas [121]. Every annual report from FY2021 to FY2025 describes it as tyre manufacturing and tyre sales in the PRC [122] [123]. Over the same period the retained Malaysian business held by the controlling shareholder, and the call option and right of first refusal over it, stop being described in the annual reports, while the group builds its own Malaysian base at a different site [124] [125].
Definition and disclosure changes
| Change | Before | After | Effect on comparability |
|---|---|---|---|
| Segment reporting | FY2021 note 5: one operating segment, manufacturing and selling of tyre products [126] | FY2022 note 5: two segments defined by operating location, domestic and overseas [127] | FY2021 is restated on the new basis inside the FY2022 report, so the series begins in FY2021 and not earlier |
| Ratio label in the Financial Highlights | FY2021 and FY2022 report a Gearing ratio of 56.9 and 55.4 per cent [128] | From FY2023 the identical row is labelled Asset to liability ratio, with the same historical values [129] | Values are unchanged; the label change matters because the management discussion separately reports a different gearing ratio, defined as net debt over total capital, which was minus 5.7 per cent in FY2025 [130] |
| Off-the-road project cost | FY2024 chairman's statement: approximately RMB1.17 billion [131] | FY2024 management discussion and FY2025 report: RMB1.11 billion [132] [133] | Two figures for the same project inside one annual report; neither is reconciled |
| Off-the-road unit capacity | FY2024: 840 thousand high-performance engineering radial tyres per year [134] | FY2025: 84 thousand per year, with the same 10 thousand giant tyres, the same 50 thousand tonnes and the same RMB1.0 billion output value [135] | A tenfold restatement of the unit figure with no note; the tonnage and output-value anchors did not move |
| Malaysia project cost | FY2024: US$380 million [136] | FY2025: US$299 million on identical capacity and output-value assumptions [137] | Project economics stated at approval cannot be tracked against a stable cost base |
| Dividend cadence | FY2021 to FY2023: final dividend only | FY2024 adds an interim dividend of HK$0.15; FY2025 declares a final dividend only [138] [139] | Year-on-year dividend comparisons need the interim added back; the reported cash distribution in a calendar year also lags the fiscal year it relates to |
The trade-measure record
Trade actions are external events, but they set the timing of the group's two largest capital decisions: Thailand after 2018, and Malaysia after 2024. The dated record is unusually specific.
| Date | Measure | Rate applying to the group |
|---|---|---|
| 24 September 2018 | United States additional tariff on Chinese imports, covering all tyres exported to the United States in the track record period | 10 per cent, raised to 25 per cent on 10 May 2019 [140] [141] |
| 15 February 2019 | United States anti-dumping and countervailing order, Chinese truck and bus tyres | Combined deposit rate 42.16 per cent [142] |
| 23 December 2021 | First administrative review, countervailing duty, Chinese truck and bus tyres | Shandong company deposits at 17.47 per cent [143] |
| 19 July 2021 | United States anti-dumping order, Thai passenger and light-truck tyres | Average 17.06 per cent [144] |
| January 2024 | First administrative review of that order | Average 4.52 per cent [145] |
| 10 October 2024 | United States anti-dumping final determination, Thai truck and bus tyres | 12.33 per cent [146] |
| 6 May 2025 | Second administrative review, Thai passenger and light-truck tyres | 5.08 per cent [147] |
| 20 September 2024 | South Africa anti-circumvention investigation covering exports via Cambodia, Thailand and Vietnam | Preliminary 6.61 per cent; still under review [148] |
| 21 May 2025 and 6 November 2025 | European Union anti-dumping then countervailing investigations into Chinese passenger and light-truck tyres, with import registration from 22 January 2026 permitting retroactive duty | Not yet determined [149] |
The rival record against which these rates should be read sits in Competition.
Leadership and governance events, dated
The people who hold these roles now, and their incentives, belong to People. What the record shows is the sequence.
| Date | Event |
|---|---|
| 5 March 2018 | Che Hongzhi, the founder, re-designated as a non-executive director and appointed chairman [150] |
| January 2021 | Che Baozhen ceases to serve as general manager of the Shandong operating company, remaining chief executive of the group [151] |
| November 2022 | Jiang Xizhou, hired from Giti Tire in 2019, becomes executive vice president [152] |
| June 2023 | Shi Futao ceases to serve as chief financial officer, remaining an executive director [153] |
| 28 March 2024 | Jiang Xizhou appointed a director; Cao Xueyu resigns as a director and continues as company secretary [154] |
| 30 December 2024 | Jiang Xizhou becomes executive president [155] |
| December 2025 | Thailand and Shandong general managers exchange posts [156] |
| March 2026 | Leo Chan joins as an independent non-executive director; the audit and risk management committee is reconstituted as all non-executive [157] |
| 1 August 2026 | Che Baozhen steps down as chief executive; Jiang Xizhou becomes president [158] |
Headcount over the same span moved from 6,450 at end-2021 to 6,834 at end-2025, a 6 per cent increase against a 57 per cent increase in revenue and a 57 per cent increase in tyres sold [159] [160].
Gaps in the record
Three absences are material enough to name rather than smooth over. First, the FY2018 to FY2020 annual reports are not in this corpus, so the disclosed application of the RMB729.5 million of listing proceeds, and the reported cost and first-year economics of Thailand phase I, cannot be sourced here. Second, no project in the corpus has a disclosed realised return, payback or internal rate of return, despite the prospectus setting an explicit 10 per cent and ten-year hurdle. Third, the earnings-call record stops in August 2021; there is no transcript covering the Anhui suspension, the Thai shutdown, the Malaysia cost restatement or the FY2025 profit decline, so management's contemporaneous explanation of each rests on the annual reports alone.
Control and incentives, as they stand
Prinx Chengshan is a single-class Cayman holding company whose votes sit almost entirely with one family. At 31 December 2025 the Che family's disclosed long position was 449,301,000 shares, or 70.35% of the 638,645,000 in issue, held through Chengshan Group and its Hong Kong trading subsidiary [1]. The chairman is the founder; the chief executive is his son [2]. Two of the remaining three non-executive seats are filled by executives of corporate shareholders — Sinotruk at 8.59% and the Red Avenue group at 5.12% [3].
The incentive architecture is in the middle of a reset. Every share option the company ever granted is gone: the 2019 and 2020 tranches expired in July 2025 and all 17,556,500 options remaining from the 2021–2023 grants were forfeited for missed performance targets, leaving zero options outstanding and a ¥38.2 million reversal of previously booked expense [4][5]. In their place sits a 2024 share award scheme that hands selected employees shares at a nil purchase price, funded by market purchases rather than issuance [6].
Figures are quoted in the currency the filings print them in. The financial statements report in renminbi (¥); share prices, option strikes, per-share dividends and the senior-management emolument bands are disclosed in Hong Kong dollars (HK$).
Controller voting stake
Look-through economics, Che Baozhen + Li Xiuxiang
Held outside controller and 5%-plus holders
Board seats held by shareholder-linked non-executives
Sources: FY2025 Annual Report — the substantial shareholders' table, where Sinotruk (Hong Kong) Capital Holding Limited is beneficial owner of 54,873,500 shares in a long position of 8.59% [7], and the directors' interests table, where Che Baozhen is deemed interested in 449,301,000 shares in a long position of 70.35% [8]; look-through economics derived from the disclosed chain in which Che Baozhen directly owned 50% of Shanghai Chengzhan, which owned 95% of Beijing Zhongmingxin, which controlled 39.79% of Chengshan Group [9].
The control chain
The 70.35% is not held directly by any individual. Chengshan Group Co., Ltd. is the beneficial owner of 436,600,000 shares — 68.36% — and is deemed interested in a further 12,701,000 shares, 1.99%, held by its wholly owned Chengshan Trade (Hong Kong) Limited [10]. Above Chengshan Group, the disclosed chain runs: Che Baozhen and his mother Li Xiuxiang each own 50% of Shanghai Chengzhan Information Technology Centre, which owns 95% of Beijing Zhongmingxin Investment Co., Ltd., which controls 39.79% of Chengshan Group [11]. Chairman Che Hongzhi appears in the register only through his spouse Li Xiuxiang; Bi Wenjing appears through her spouse Che Baozhen [12][13].
Multiplying that chain out, Che Baozhen's look-through economic interest in Prinx Chengshan is roughly 13.3%, and Li Xiuxiang's is the same — about 26.6% of the economics between them, against 70.35% of the votes those shares carry. The annual report does not disclose who holds the other 60.21% of Chengshan Group. At listing in 2018 the prospectus stated that the Che family and its controlled entities were collectively deemed interested in 76.76% of Chengshan Group's equity [14]; no equivalent breakdown appears in the FY2025 report.
Source: FY2025 Annual Report — the substantial shareholders' table, where Chengshan Group is beneficial owner of 436,600,000 shares in a long position of 68.36% [15], and the directors' and chief executive's interests table, where Jiang Xizhou is beneficial owner of 4,450,000 shares in a long position of 0.70% [16]. Percentages are calculated on 638,645,000 shares in issue at 31 December 2025; the deemed-interest rows describe the same block of shares, not additive stakes.
The stake has crept up, not down
Chengshan Group's own registered holding is 436,600,000 shares, the same number it held at the October 2018 listing, when that was 68.76% of the enlarged capital [17]. It did not sit still in between: the direct line ran at 441,859,500 from FY2021 to FY2023, then came back to 436,600,000 in FY2024 as the balance was re-registered in the Hong Kong trading subsidiary [18]. Everything the family has added since sits there. The family's disclosed long position held flat at 69.43% through FY2021 to FY2023 [19][20][21], rose to 69.56% in FY2024 [22], and reached 70.35% in FY2025 [23]. Over the same window Sinotruk went the other way, from 9.69% to 8.59%.
Sources: Substantial Shareholders' Interests — Sinotruk (Hong Kong) Capital Holding Limited as beneficial owner of 61,672,000 shares in a long position of 9.69% in FY2021 [24], 61,400,000 and 9.65% in FY2022 [25] and again in FY2023 [26], 54,914,500 and 8.62% in FY2024 [27] and 54,873,500 and 8.59% in FY2025 [28]; the controller line is drawn from the Chengshan Group and Beijing Zhongmingxin rows of the same tables, cited above.
What a minority holder can and cannot reach
There is one class of shares and one vote each, so 70.35% of the register is 70.35% of every ordinary and special resolution. The company confirms at least the 25% minimum public float [29], but of the 29.65% outside the controller, 8.59% is Sinotruk and 5.12% is the Red Avenue group [30] — both counterparties in the related-party ledger below. That leaves about 15.9% genuinely dispersed. Shareholders holding at least one-tenth of the paid-up voting capital may requisition an extraordinary general meeting, and the board must convene it within two months or the requisitionists may do so themselves [31]. No pre-emptive rights attach to new shares under the articles or Cayman law [32].
Two structural commitments run alongside the stake. A deed of non-competition signed on 10 September 2018 binds Chengshan Group, Che Hongzhi, Li Xiuxiang, Che Baozhen, Bi Wenjing and a list of family investment vehicles not to compete with the tyre business in the PRC; the independent non-executive directors reviewed compliance for 2025 and were satisfied [33]. Separately, the March 2024 Bank of China (Thai) and HSBC Bangkok facilities for the Thai subsidiary carried specific-performance covenants requiring the controlling shareholders to stay the largest shareholder and to maintain management control, with breach triggering a right to demand repayment; both agreements had expired by the date of the FY2025 report [34]. No pledge or encumbrance over controller shares is disclosed in the FY2025 report.
Board and committees
Nine directors: three executive, three non-executive, three independent — exactly the one-third independent minimum under Listing Rule 3.10A, which the company confirms it meets [35]. One director is female, which the company describes as achieving gender diversity [36]. Executive directors hold three-year service contracts; independent directors hold letters of appointment of one to three years; all are subject to retirement by rotation [37].
The disclosed independence and the observed affiliations are different facts and are worth separating. The company has received and accepted Rule 3.13 independence confirmations from all three independent directors [38]. Separately, the biographies show that each of the three non-executive seats maps to a disclosed shareholder: Che Hongzhi has chaired Chengshan Group since December 2003 [39]; Shao Quanfeng has spent his career inside the Sinotruk group and since June 2025 has been financial controller of China Heavy Truck Group International; Wang Ning has worked in the board office of Red Avenue New Materials Group since February 2022 and was appointed its securities affairs representative in April 2022 [40]. The annual report discloses no shareholders' agreement or contractual nomination right behind those appointments.
Sources: FY2025 Annual Report, Directors and Senior Management — biographies, with the date each was appointed a Director: Che Baozhen and Shi Futao [41], Jiang Xizhou and Che Hongzhi [42], Shao Quanfeng and Wang Ning [43], Jin Qingjun [44], Wang Chuansheng [45] and Chan Chi Fung, Leo [46]; committee membership from the Corporate Governance Report — the Audit Committee [47] and the Nomination and Remuneration Committee [48].
The committee structure is three-part: Audit, Nomination and Remuneration, and Development Strategy and Risk Management. Through 2025 the Audit Committee was all-independent under Choi Tze Kit Sammy; the Nomination and Remuneration Committee had two independents and one non-executive, Wang Ning, under Jin Qingjun [49][50]. With effect from 30 March 2026 the Audit Committee is renamed the Audit and Risk Management Committee and the Development Strategy and Risk Management Committee becomes the Development Strategy and ESG Committee [51]. Five board meetings, three audit meetings, four nomination and remuneration meetings, four development strategy meetings and one AGM were held in 2025, and no director missed a meeting the attendance table records against them [52].
Source: FY2025 Annual Report, Corporate Governance Report — the table setting out the attendance record of each Director at the Board meetings, Board Committee meetings and general meetings held during the year [53].
Operators, and the turnover behind them
Che Baozhen joined the group in December 2005, became a director in May 2015, ran the main Shandong operating subsidiary from April 2017 to January 2021 and is a director of nearly every subsidiary [54]. The finance function changed hands in 2023: Shi Futao, who joined in 2004 as financial director, ceased to serve as chief financial officer in June 2023 while staying an executive director, and Huang Xiaolei — senior financial controller from October 2022, previously at Baosteel, Luolai and Marcolin — took the CFO title in June 2023 [55][56].
The clearest succession build is Jiang Xizhou. He arrived in August 2019 as assistant to the general manager after roughly 24 years at Giti Tire entities, became deputy general manager in January 2020, executive vice president in November 2022, an executive director in March 2024 and executive president on 30 December 2024 [57]. He is also the highest-paid director.
Source: FY2025 Annual Report, Directors and Senior Management — Che Baozhen joined the Group in December 2005 [58]; Jiang Xizhou joined the Company in August 2019 as an assistant to the general manager [59]; Huang Xiaolei has been senior financial controller of the financial centre since October 2022 and chief financial officer since June 2023 [60]; and Xu Jiangang became general manager of Prinx Thailand in December 2025 [61].
Four of the nine board seats have changed hands since September 2023, and the chief executive role changes hands in August 2026. The stated reasons are, in every case, personal or administrative rather than performance- or dispute-related.
Sources: FY2023 Annual Report — the term of office of Zhang Xuehuo expired on September 9, 2023 [62]; FY2024 Annual Report — Cao Xueyu resigned as an executive Director on March 28, 2024 [63]; FY2025 Annual Report — Choi Tze Kit Sammy resigned as chairman of the Audit Committee with effect from March 1, 2026 [64]; the August 2026 row rests on trade and newswire reporting of an exchange filing — “Che resigning as Prinx Chengshan CEO”, 21 July 2026 — not on a filing in this corpus [65].
Two of those changes shifted the character of the non-executive bench. Wang Lei, who left in March 2024, was a Chengshan Group career administrator — head of its general office from 2009 and deputy general manager of its administrative centre from 2014 [66]. His replacement, Wang Ning, comes from the Red Avenue group, whose Sino Legend chain first appears in the substantial-shareholder register in the FY2024 report at 5.13% [67][68]. The controlling family gave up one of its two non-executive seats in the same month a new 5% holder appeared; the filings state no causal link between the two.
On 21 July 2026 trade press and newswires reported an exchange filing under which Che Baozhen steps down as chief executive with effect from 1 August 2026, remaining an executive director focused on global strategy, with Jiang Xizhou taking a newly created President role [69]. The underlying announcement is not in this corpus, and the FY2025 report — signed 30 March 2026 — records no subsequent event [70].
What the pay pays for
Total directors' emoluments were ¥14.48 million in FY2025, down from ¥16.44 million in FY2024 — RMB14,477 thousand against RMB16,444 thousand as the note prints them [71]. The trajectory since FY2021 is a step up in FY2023–FY2024 and a partial give-back in FY2025, driven mostly by share-based amounts.
Sources: directors' emoluments notes, in RMB'000 — the FY2021 table, where Che Baozhen's total is 3,688 and Che Hongzhi's 244 [72]; the FY2022 table, where Che Baozhen's total is 2,846 [73]; the FY2023 note totalling 12,298 [74]; the FY2024 note totalling 16,444 [75]; and the FY2025 note totalling 14,477 [76].
Three features of the FY2025 table stand out on the record. The chairman and both other non-executive directors — Che Hongzhi, Shao Quanfeng and Wang Ning — were paid nothing [77]. Che Hongzhi had already waived ¥215,000 of his FY2024 fee [78]. The chief executive is the lowest-paid of the three executive directors, at ¥3.64 million against ¥4.37 million for Shi Futao and ¥5.92 million for Jiang Xizhou. And the three independent directors are paid fees of ¥163,000 to ¥217,000 — under 6% of an executive director's package [79].
Source: FY2025 Annual Report, Note 38 Benefits and Interests of Directors — the FY2025 table, where Jiang Xizhou's total is 5,923, Shi Futao's 4,374 and Che Baozhen's 3,637, in RMB'000 [80].
The bonus line is disclosed as "discretionary" and no metric, weight, threshold or hurdle is published for it. What the annual report does say is procedural: the Nomination and Remuneration Committee reviews management remuneration against comparable companies, time commitment and individual and company performance, assesses executive directors' performance, and no director may decide their own remuneration [81][82]. No clawback provision is disclosed anywhere in the report. Beneath the board, seven senior managers were paid in bands running from HK$1,000,001 to HK$2,000,000 at the bottom to HK$6,000,001 to HK$7,000,000 at the top [83], and key management compensation across directors and senior management totalled ¥20.70 million in cash and ¥1.61 million share-based [84].
Set against that, the proposed FY2025 final dividend is HK$0.50 per share, HK$319.3 million in total, or ¥288.4 million [85][86]. The controller's 449,301,000 shares attract about HK$224.7 million of it — roughly fourteen times the entire board's emoluments. The controlling family's return on this company runs through the dividend, not the payroll.
The option scheme that paid nothing
At the start of FY2025 there were 22,658,345 options outstanding at a weighted average exercise price of HK$8.28, of which 5,101,845 were vested and exercisable [87]. By 31 December 2025 there were none. Employees exercised 1,238,000 at HK$7.244; 3,863,845 lapsed on the July 2025 expiry of the 2019 scheme grants; and 17,556,500 were forfeited because the performance targets attached to the 2021, 2022 and 2023 grants were not met [88][89]. The accounting consequence was a ¥38.2 million reversal of employee benefit expense through profit or loss, against ¥2.20 million of award-scheme expense recognised [90].
Two things were true of those forfeited options at once, and they are separable. The vesting conditions were performance conditions and the company states they were not met [91]. And the strike was HK$8.568, set at the 2021 grant and then carried forward unchanged as the floor for the 2022 and 2023 grants even though the shares closed at HK$6.410 and HK$6.54 on those two grant dates — so the later grants were struck roughly a third above the market on the day they were made [92][93].
Sources: FY2025 Annual Report, Report of the Directors — 14,400,000 share options conditionally granted in 2019 [94], 835,500 in 2020 [95], 35,050,000 in 2021 [96] and 3,080,000 in 2022 and 960,000 in 2023 [97]; vesting terms and outcomes from the share scheme notes, where the unvested share options lapsed because the vesting conditions had not been met [98], and from Note 26 Share-based Payments, which records the options lapsed during the year [99] and those forfeited in accordance with the terms of the 2021 Share Option Scheme [100].
For reference on where the strike now sits: on the daily market record the shares closed at HK$7.78 on 30 December 2025 and at HK$6.815 on 3 August 2026, against the HK$8.568 exercise price set on the 2021 grant date [101]. The 2021 Share Option Scheme itself remains alive with 10,910,000 shares — 1.71% of issued capital — still available for grant, and about three years and two months of life left [102].
What replaced it
The 2024 Share Award Scheme, adopted 31 May 2024, grants shares outright at a nil purchase price. It is capped at 4,200,000 shares, about 0.66% of issued capital, with no single employee taking more than 0.28%. Nothing vests inside three years of the first grant; the intended schedule is 30% at 36 months, 30% at 48 months and 40% at 60 months, and the board may attach service or performance conditions at its discretion [103]. Non-executive and independent non-executive directors are excluded [104].
Because the shares are bought on-market by a trustee rather than issued, the scheme dilutes nobody but consumes cash: the board approved up to HK$35 million for the trustee in June 2025, and 4,000,000 shares had been purchased by 31 December 2025 against 2,620,000 awarded and 100,000 cancelled [105]. The December 2025 grant of 1,260,000 shares was priced at a grant-date fair value of HK$9.765 million, with the shares closing at HK$7.82 the day before [106]. That second grant also shortened the ladder to 24, 36 and 48 months [107].
Sources: FY2025 Annual Report — the participant table setting out options and awards granted, exercised, cancelled and lapsed during the year [108]; the scheme notes, where the purchase price of the granted share awards is HK$0 [109]; and Note 26 Share-based Payments, where the board of directors resolved to grant 1,260,000 awarded shares [110], and where the total fair value of the shares granted in FY2024 was HKD10,036,800 [111].
Neither the chief executive nor the chairman holds any award or option. Che Baozhen's only remaining personal exposure was 390,533 options from the 2019 grant, which lapsed in FY2025; he now appears in the register solely through the controlled-corporation chain [112][113].
Insider and controller activity
Sources: 2018 prospectus, where Chengshan Group holds 436,600,000 shares, or 68.76%, after the global offering [114]; Substantial Shareholders' Interests showing Chengshan Group at 441,859,500 shares and 69.43% in FY2021 [115], Li Xiuxiang at 443,359,500 and 69.56% in FY2024 [116] and Shanghai Chengzhan at 449,301,000 and 70.35% in FY2025 [117]; the Note 26 summary recording 1,238,000 options exercised during the year [118], the Trustee's holding of 4,000,000 Shares purchased under the 2024 Share Award Scheme [119] and the HK$8.04 weighted average closing price of the shares before the options were exercised [120]; the buyback line from Purchase, Sale or Redemption of Listed Securities, where nothing was sold or redeemed [121].
No director bought or sold shares on the open market in FY2025. All directors confirmed compliance with the Model Code, and no relevant-employee breach was noted [122].
Related parties
The related-party book is bigger than the connected-transaction disclosures suggest, because the largest lines are exempt from the Listing Rules' announcement regime. Sales to Sinotruk — the group whose Hong Kong arm holds 8.59% of the shares — reached ¥738.5 million in FY2025, up 85.9% from ¥397.3 million, or roughly 6.3% of group revenue [123]. Trade receivables from Sinotruk rose faster still, from ¥163.8 million to ¥511.3 million, all of it aged under six months [124].
The company's own framing is that, apart from the two continuing connected transactions and the trustee payment, these are related-party transactions that do not constitute connected transactions under Chapter 14A, with the purchase of water and electricity from Chengshan Group fully exempt from disclosure [125].
Two more lines are new in FY2025. Chengshan Group advanced ¥230 million to the group as a three-year loan at a fixed 3%, with ¥2.68 million of interest charged in the year [126] — money flowing from the controller to a company that ended FY2025 in a net cash position. And payments to the share award trustee became a connected transaction in their own right, because connected persons' aggregate interest under the scheme exceeds 30%, making the trustee an associate under Rule 14A.12(1)(b) [127].
Sources: FY2025 Annual Report, Note 36 Related Party Transactions, in RMB'000 — the related-party relationships, including the associated company established on 26 October 2023 with a 40% equity interest [128]; the purchase of utilities from Chengshan Group of 216,079 against 204,926 [129]; and rental and estate management expenses paid to Rongcheng Chengshan Properties of 6,415 [130]; and Report of the Directors — Related Party and Connected Transactions [131], including the energy management cap of 11,000 against 10,738 transacted [132].
Both continuing connected transactions ran inside their caps and both are on three-year agreements dated 19 December 2023 expiring 31 December 2026 [133]. The independent non-executive directors reviewed them and confirmed they were on normal or better commercial terms, and the auditor issued an unqualified Practice Note 740 letter [134]. Neither review covers the ¥216.1 million utilities purchase or the ¥738.5 million of Sinotruk sales, which fall outside Chapter 14A [135].
Officer and director docket, and the oversight record
The company reports no material legal proceeding or arbitration for FY2025, and none pending or threatened to the directors' knowledge [136]. No regulatory proceeding, investigation, sanction or settlement touching a current officer or director appears anywhere in the FY2021–FY2025 reports. Directors' and officers' liability insurance is in place and reviewed annually [137][138]. The company also confirms it met its listing undertaking on business with sanctioned countries, and that no such business took place in 2025 [139].
Sources: FY2025 Annual Report, Report of the Directors — no material legal proceeding or arbitration for the year [140] and the Auditor section, where no change in the auditor is recorded in any of the preceding three years [141]; Corporate Governance Report — Risk Management and Internal Control [142], Auditor's Remuneration, where non-audit services are 386,043 [143], Chairman and Chief Executive Officer [144] and Changes in Constitutional Documents, where the seventh amended and restated Memorandum and Articles of Association was adopted on May 31, 2024 [145].
What the record does not settle
Three things a reader of the filings alone cannot resolve. First, the ownership of the 60.21% of Chengshan Group that sits outside the Beijing Zhongmingxin chain is not disclosed in any annual report in this corpus, so the economic split behind the 70.35% voting block cannot be pinned down beyond the Che Baozhen and Li Xiuxiang halves. Second, the discretionary bonus that accounted for ¥5.21 million of FY2025 director pay carries no published metric, weight or threshold, so its relationship to the year's 17.1% fall in net profit, to ¥1,087.6 million [146], cannot be tested from the disclosure. Third, the 17.6 million options forfeited in FY2025 are described only as having failed unspecified "performance targets in the offer letter" — the targets themselves were never published, so what management was asked to hit between 2021 and 2025, and by how much they missed, is not on the record.
The related-party direction of travel is a separate open item: Sinotruk is simultaneously an 8.59% shareholder, the source of a board seat, the largest related-party customer at ¥738.5 million, and the counterparty behind a ¥511.3 million receivable that grew faster than the sales that generated it. The business context for that concentration belongs to Business; the multi-year record of what the controller has done with the company's capital belongs to History.
What the company sells
Bottom line. Prinx Chengshan sold 29.3 million tyres in FY2025 for ¥11,806.8 million and kept ¥1,087.6 million of profit — about ¥37 per tyre [1]. Operating costs below the gross line are close to fixed at 8.6% of revenue, so nearly the whole earnings swing since FY2021 came from gross margin. Two plants, a distributor network the company does not own, and a third build cycle now starting define the rest.
The company began as a Shandong rubber factory in 1976 and now designs, manufactures and sells tyres from two production bases — Rongcheng in Shandong and Chon Buri in Thailand — with a third under construction in Kedah, Malaysia, two research and development centres in China, and sales centres in China, North America and Europe [2]. Product reaches over 160 countries [3]. Roughly 6,800 people run it [4]. The product taxonomy and the arena it competes in are set out in Industry; this chapter is about the mechanics of the money.
Revenue (¥m)
Gross margin
Profit for the year (¥m)
Net cash (¥m)
Free cash flow (¥m)
Sources: FY2025 consolidated statement of profit or loss [5] and statement of financial position [6]; net cash and free cash flow per the run's shared financial series, derived from the same filings.
The revenue line divides into three products, and the division matters more than its size suggests. All-steel radial tyres — truck and bus fitments — were 8.4 million of the 29.3 million sets sold, but ¥6,664.2 million of the ¥11,806.8 million of revenue. Semi-steel radials for passenger cars were 20.4 million sets and ¥4,936.1 million. Bias tyres were 0.5 million sets and ¥201.4 million [7] [8].
Source: sales volumes per the FY2025 operation review [9] against revenue by product type [10]. Shares derived.
Dividing revenue by volume gives an average realised price of about ¥793 per all-steel tyre against ¥242 per semi-steel tyre — a truck tyre carries roughly 3.3 times the revenue of a car tyre. (Volumes are disclosed rounded to 0.1 million sets, so these unit figures carry about a percentage point of rounding.) Just over a quarter of the units therefore produce more than half the revenue, so the top line is most sensitive to the mix between them: at those realised prices, moving one percentage point of the 29.3 million sets from semi-steel to all-steel adds about ¥160 million of revenue, or 1.4% of the FY2025 total. Management describes FY2025 growth in both products as volume and price together: all-steel revenue rose 6.3% on a 5.3% volume gain and a slight price rise, semi-steel 9.8% on a 4.9% volume gain and a 4.7% price rise [11].
Per tyre sold, gross profit has ranged from ¥55.9 to ¥84.9 across the five years to FY2025, and profit for the year from ¥14.9 to ¥46.9.
Source: derived — gross profit and profit for the year from the five-year summary [12], divided by sales volume as disclosed for each year [13] [14] [15] [16] [17].
Between FY2021 and FY2024 the company more than tripled what it kept on each tyre, from ¥14.9 to ¥46.9, while volume grew 51%. FY2025 gave back a fifth of that level, to ¥37.1, even as volume rose again. Volume and unit profit have moved on different clocks, and the second one is not under management's control in the way the first is.
Channels and payment terms
The buyer of 83.7% of FY2025 revenue was a distributor, not a driver and not a carmaker. International distributors took ¥7,796.6 million, domestic distributors ¥2,078.9 million, and direct sales to automobile manufacturers ¥1,926.3 million [18].
Sources: sales-by-channel tables in the FY2022 [19], FY2023 [20], FY2024 [21] and FY2025 [22] annual reports. FY2021 is stated on the FY2022 report's restated basis, which folds private-label revenue into international distributors. Small raw-material trading revenue is excluded.
Four years of growth came from one place. International distributor revenue rose 82% between FY2021 and FY2025; domestic distributor revenue ended the period at ¥2,078.9 million against ¥2,043.0 million four years earlier, having fallen in three of those years. The direct-to-manufacturer channel is the volatile one — ¥1,209.2 million, then ¥619.1 million, then a climb to ¥1,926.3 million in FY2025, a 73.9% jump on a 57.6% rise in OE volume [23].
Management is explicit that the two moved together by design: it "tilted its production capacity to focus on ensuring the development of its export and OE businesses, which in turn led to a corresponding decrease in the sales of commercial vehicle tire replacement" [24]. That is a choice with a cash consequence, developed below.
No single customer is large. The top five accounted for 13.4% of FY2025 revenue and the largest for 3.7% [25]. Neither is any single supplier: the top five were 18.5% of purchases. This cuts both ways. No counterparty can dictate terms, and no counterparty is contractually obliged to keep buying — the switching terms behind that are set out in Competition.
What the company owns instead of customers is a network it organises but does not consolidate: 126 domestic distributors, 25,389 registered retail stores, and 8,078 stores on the "lighthouse e-station" ordering platform, of which 770 are top-tier accounts [26]. None of it sits on the balance sheet. The commitment that does is a four-year product warranty, carried as a ¥40.7 million charge in FY2025 [27] [28] — about a third of a percent of revenue.
At the 2018 listing the company granted customers a credit period of no more than two months, and receivable turnover ran 66 to 82 days [29]. That is the working-capital shape the distributor model was built on, and FY2025 is the year it stretched.
Where the tyres are made, and what that does to the margin
The company reports two segments, and they are defined by where production happens, not by where the customer is: a Domestic segment (Shandong) and an Overseas segment (Thailand) [30]. Shandong produced about 62% of FY2025 revenue and Thailand about 38% [31].
Delivery destination is a separate cut and looks nothing like the production split: China took ¥3,997.2 million of FY2025 revenue, the Americas ¥3,901.9 million, Asia excluding China ¥1,126.6 million, Africa ¥1,007.3 million, the Middle East ¥787.8 million and other countries ¥986.1 million [32]. Because anti-dumping and countervailing duties are assigned by country of production rather than country of sale, the segment split — not the destination split — is what trade measures price.
That is visible in the plants' own utilisation. Design capacity is 7.4 million all-steel and 11.53 million semi-steel sets a year in Shandong, and 2 million all-steel and 10 million semi-steel sets in Thailand. In FY2025 Shandong ran its all-steel lines at 93.8% against 82.6% a year earlier, while Thailand's all-steel utilisation fell to 80.6% from 87.1% [33]. The US anti-dumping duty on truck and bus tyres from Thailand, set at 12.33% for the group in October 2024, is the obvious candidate for that divergence [34].
Source: derived from segment revenue and segment results in the FY2022 [35], FY2023 [36], FY2024 [37] and FY2025 [38] annual reports. Segment results are stated before selling, administrative and research and development expenses, which the company does not allocate by segment.
Thailand's margin advantage was one percentage point in FY2021, widened to 11.7 points by FY2024, and halved to 6.0 points in FY2025. The dated record of how that base was built sits in History; what matters for the economics is that a plant carrying 38% of revenue delivered 46.2% of group gross profit in FY2025, down from 50.6% in FY2024.
Sources: segment revenue and results for FY2025 and FY2024 [39] [40]; non-current assets by location [41]. Margins derived.
The asset side is the asymmetry worth holding on to. Excluding deferred tax and associates, ¥2,965.7 million of non-current assets sit overseas against ¥2,440.4 million domestically — 54.9% of the fixed base in the plant that generates 38% of revenue [42]. Shandong turns ¥2.98 of revenue per ¥1 of non-current assets; Thailand turns ¥1.53. Thailand is the higher-margin, more capital-hungry and more tariff-exposed half of the company, and its margin premium is the variable that has moved most.
The cost structure and where the leverage sits
Below the revenue line the company is unusually simple. Raw materials and consumables were ¥8,400.2 million in FY2025 against ¥10,683.6 million of total costs across cost of sales, selling, administrative and research and development expenses — 78.6% of everything the company spends, and 71.1% of revenue on its own. Wages were ¥808.1 million and depreciation of property, plant and equipment ¥500.9 million [43]. The relationship between input prices and realised prices, and the lag between them, is the industry mechanic set out in Industry.
The three lines below gross profit have barely moved. Selling and distribution expenses were ¥522.2 million in FY2025 against ¥517.0 million in FY2024; administrative expenses ¥233.4 million against ¥236.0 million; research and development expenses ¥259.0 million against ¥250.7 million [44]. Together they came to ¥1,014.6 million, or 8.59% of revenue.
Sources: gross margin and operating margin per the five-year summary and key indicators [45] [46]; operating expenses are selling and distribution, administrative and research and development expenses as disclosed in each year's segment note [47] [48] [49], divided by revenue. Ratios derived.
Over FY2021 to FY2025 revenue grew 56.6% and those operating expenses grew 16.9%, falling from 11.51% of revenue to 8.59%. Gross profit grew 105.7% and operating profit — the line the accounts strike before finance items, and the measure the operating-margin series in the chart above divides by revenue — grew 341%, from ¥271.0 million to ¥1,194.4 million [50] [51]. Net finance costs of ¥0.2 million in FY2025 make that the same ¥1,194.4 million the accounts report as profit before income tax, the figure Valuation and Discount uses; it reconciles to profit for the year of ¥1,087.6 million at the 8.9% effective rate, and sits ¥21.7 million below the ¥1,216.1 million of EBIT used in Return on Capital. Operating margin rose 6.5 percentage points over that span. Gross margin contributed 4.3 points and the fall in operating expenses 2.9; the roughly 0.7-point difference is smaller other gains, which fell from ¥40.6 million in FY2021 to ¥19.7 million in FY2025.
That fixes the sensitivity. At FY2025 revenue, one percentage point of gross margin is ¥118.1 million — about a tenth of profit for the year after tax at the FY2025 effective rate of 8.9%. A 1% move in the raw-material bill is ¥84.0 million, or 7.0% of profit before income tax. Prices are set by distributors' willingness to pay and by duty schedules; costs are set by rubber, carbon black and steel cord markets. The company's own explanation for the FY2025 decline names both: "fluctuations in raw material prices and the impact of U.S. tariff policies" [52].
One qualification on the FY2025 fall. Trade-press reporting of the interim result puts first-half revenue at ¥5,705.2 million with attributable profit down 37.4% to ¥507.6 million [53]. Against full-year profit of ¥1,087.6 million, that implies roughly ¥580 million in the second half — above the ¥500 million implied for the second half of FY2024 on the same reporting, which put first-half FY2024 profit at ¥811.4 million [54] — and achieved despite a suspension that held the Thai plant to trial production from 8 August to 4 September 2025, with normal production resuming on 5 September [55]. No interim filing sits in this corpus, so the half-year split rests on secondary reporting and should be treated as indicative. On that basis the FY2025 decline reads as a first-half event rather than a full-year deterioration, which is the strongest single fact against reading FY2024 as a peak.
The balance sheet and the cash cycle
Property, plant and equipment of ¥5,056.7 million is 43.1% of ¥11,744.7 million of total assets [56]. Against it sits ¥7,189.5 million of equity, an asset-to-liability ratio of 38.8% and a return on equity of 15.8%, down from 21.9% [57]. The company ended FY2025 with ¥643.4 million of net cash on the run's shared measure; on its own definition, borrowings of ¥682.9 million [58] against ¥1,099.8 million of cash and restricted cash gave a gearing ratio of -5.7% [59] [60]. Either way, the debt burden is small.
The receivable line is where FY2025 shows strain. Trade and notes receivables rose ¥421.0 million to ¥2,441.6 million, and amounts due from related parties rose ¥351.5 million to ¥553.4 million [61]. Those two increases total ¥772.5 million against a revenue increase of ¥832.9 million. Days sales outstanding on trade and notes receivables went from 67.2 to 75.5; including related-party balances, from 73.9 to 92.6. Management attributes the trade movement to "the increased sales share to automobile manufacturers through direct sales channels, which have a longer accounts receivable collection period" [62] — the cash price of the channel tilt described above.
The ageing schedule sharpens it. Balances invoiced 4 to 6 months earlier rose from ¥3.1 million to ¥229.6 million, and the share of receivables under three months old fell from 99.5% to 89.2% [63]. That is a change of kind, not only degree, in a business that historically collected inside its two-month credit term.
The counterweight is inventory. Inventories fell ¥268.0 million to ¥1,674.9 million, taking inventory days from 82.0 to 63.2 [64] [65]. On the trade-only measure the cash conversion cycle therefore lengthened by about 2 days; counting the related-party receivable it lengthened by about 13. Cash generated from operations was ¥1,276.9 million and net operating cash flow ¥1,201.2 million, down 3.9% on a 17.1% fall in profit — the inventory release funded the receivable build [66]. That is a one-year source of cash, not a repeatable one.
Source: free cash flow and capital expenditure intensity per the run's shared financial series, derived from the consolidated cash flow statements; the FY2025 figures reconcile to purchases of property, plant, equipment and land use rights of ¥577.3 million against operating cash flow of ¥1,201.2 million [67].
Capital intensity tells the story of the last cycle and forecasts the next one. Capital expenditure ran at 18.6% of revenue in FY2021 during the Thai build-out, producing free cash flow of about -¥1,020 million, then fell to between 4.4% and 5.4% for four years while free cash flow ran ¥559 million to ¥660 million. FY2025 capex of ¥581.5 million was close to the ¥547.5 million of depreciation and amortisation charged — replacement-level spending.
That phase is ending. The Malaysian base at Kedah Rubber City is budgeted at US$299 million, commenced construction in the third quarter of 2025 and expects trial production in the fourth quarter of 2026 [68]. The Shandong off-the-road project is budgeted at ¥1.11 billion, with trial production begun in the fourth quarter of 2025 and design capacity targeted for 2029 [69]. Together that is roughly ¥3.2 billion at year-end 2025 exchange rates — about 45% of equity, and close to three years of FY2025 operating cash flow — against ¥643.4 million of net cash and a dividend distribution of ¥293.3 million in FY2025 [70]. The projects are staged over several years and internal cash flow plus modest borrowing can plausibly carry them, but the free cash flow of the last four years was earned in a capex trough that is closing.
What this report sets out to answer
Prinx Chengshan converts rubber into 29 million tyres a year across two countries and sells them mainly through distributors it does not own, keeping about ¥37 per tyre in FY2025. The costs it can control are small and already efficient; the spread it earns is set by input prices, by what distributors will pay, and increasingly by duty schedules assigned to the country a tyre is made in. The step-change from ¥14.9 to ¥46.9 of profit per tyre between FY2021 and FY2024 came almost entirely from that spread, and it came disproportionately from a Thai plant that now holds more than half the fixed asset base and saw its margin premium halve in a single year.
The question this report exists to answer: is the profit step-up of FY2023 and FY2024 a durable property of Prinx Chengshan's multi-country manufacturing model, or the high point of a cost-and-duty spread the company does not set — and one it is now committing roughly ¥3.2 billion of new capacity against.
The evidence points, on balance, toward durability being conditional rather than established: the fixed-cost leverage is real and permanent, but 46% of gross profit rests on a single offshore plant already carrying a 12.33% US truck-tyre duty, with an EU anti-dumping investigation open against Chinese-origin passenger tyres since May 2025 and import registration permitting retroactive duty from January 2026 [71]. The strongest fact against that caution is the second-half FY2025 recovery noted above. What would settle it is a full year at the FY2025 exit run-rate with the Thai plant at pre-duty utilisation, or a definitive EU determination that leaves the Shandong base's export economics intact.
For orientation, the market capitalisation on 3 August 2026 was HK$4.33 billion, at a closing price of HK$6.815 against FY2025 earnings of RMB1.71 per share — roughly 3.6 times trailing earnings at year-end exchange rates. The valuation question that number raises belongs to a later chapter; what this one establishes is the engine those earnings come out of.
Where the gross profit went
Bottom line. Prinx Chengshan's FY2025 profit fell RMB224.3 million, and almost all of it is traceable to one plant. The Thai base accounts for 98.8% of the group's RMB191.9 million gross-profit decline, and a Pillar Two top-up tax on the same subsidiary takes another RMB70.9 million. Management names raw materials as a cause; the input evidence in peer filings does not support it. This was a trade-and-tax event in Chon Buri.
The group reported gross profit of RMB2,137.8 million in FY2025 against RMB2,329.7 million in FY2024, a margin of 18.1% against 21.2%, and attributes the decline to "fluctuations in raw material prices and the impact of U.S. tariff policies" without separating the two [1]. The segment note separates them for us. The Shandong base earned RMB1,149.4 million of gross profit on RMB7,279.7 million of revenue, against RMB1,151.8 million on RMB6,843.2 million a year earlier — a margin of 15.79% against 16.83% [2] [3]. The Thai base earned RMB988.4 million on RMB4,527.1 million against RMB1,177.9 million on RMB4,130.7 million — 21.83% against 28.52%, on revenue that grew 9.6% [4] [5].
Source: derived from segment revenue and segment results for FY2025 and FY2024 [6] [7]. Revenue-weighted decomposition of the 3.12-point fall from 21.23% to 18.11%.
Weighting each base by its share of revenue, the Thai margin contributed 2.56 points of the group's 3.12-point decline, the Shandong margin 0.64 points, and the shift of revenue mix toward the higher-margin base added back 0.08. In money rather than points: overseas gross profit fell RMB189.5 million and domestic gross profit fell RMB2.4 million, so 98.8% of the group's gross-profit decline sits in a segment that produced 38.3% of revenue.
Below the gross line, almost everything moved the other way. Net finance costs fell RMB28.6 million and other tax items were RMB36.7 million lighter; against those, the Pillar Two charge on Prinx Thailand cost RMB70.9 million, foreign-exchange-driven other gains fell RMB21.3 million and operating expenses rose RMB12.6 million [8] [9] [10].
Source: derived from the FY2025 financial review [11] [12] and the segment note [13] [14]. Components sum to the RMB224.3 million fall in profit for the year.
The two Thailand-specific lines — segment gross profit and the top-up tax — total RMB260.4 million against a group profit decline of RMB224.3 million. Everything the group did outside that plant in FY2025 was, in aggregate, a net positive.
The raw-material explanation, tested
Raw materials are the largest cost the business carries, so the first claim to check is management's own. The best available evidence says input prices eased in 2025. Linglong Tire, which discloses year-on-year purchase-price changes for each of its main inputs, bought natural rubber 7.36% dearer but synthetic rubber 7.16% cheaper, carbon black 17.42% cheaper, steel cord 5.40% cheaper and cord fabric 17.17% cheaper [15]. Its industry review states plainly that raw-material cost pressure in 2025 eased relative to 2024, as weather normalised in the natural-rubber growing regions and synthetic rubber and carbon black moved into oversupply [16].
Source: Linglong Tire FY2025 annual report, raw material procurement disclosure [17]. Prinx Chengshan publishes no equivalent table; Linglong buys the same inputs on long-term contract and spot.
Only natural rubber rose, and it is the largest of the five by purchase volume, so the basket did not fall as far as four of five lines suggest. But a rising input basket cannot explain what actually happened, because a global input shock would land on both of Prinx Chengshan's bases. The Shandong base lost 1.04 points of margin; the Thai base lost 6.69. Both bases buy in the same world markets, so a shared input shock would not produce a margin loss six times larger at one than at the other.
The same asymmetry appears across the listed Chinese makers. The levels of those peer margins are set out in Competition; what matters here is the direction each one moved in FY2025.
Sources: Prinx Chengshan segment note, FY2025 and FY2024 [18] [19]; Sailun FY2025 revenue and cost by region [20]; Linglong FY2025 revenue and cost by region [21]; Triangle FY2025 revenue and cost by region [22].
The comparison is imperfect and the table says so: Prinx Chengshan splits by where a tyre is made, the three A-share peers by where it is sold, and all three report under PRC GAAP. Even allowing for that, the pattern holds. At Sailun and Linglong the domestic line barely moved (down 0.09 and 0.25 points) while the overseas line fell 4.13 and 9.76 points. Triangle is the exception: its overseas margin rose 2.78 points, and Triangle holds RMB61.4 million of overseas assets, 0.32% of its balance sheet — it has no offshore plant and exports from China [23]. The makers whose margins broke in FY2025 are the makers who ship to the United States out of Southeast Asia.
The duty stack on the Thai base
The Thai plant exists to reach markets that China-origin tyres cannot reach economically. That is visible in the revenue-by-destination table: RMB3,901.9 million of FY2025 revenue was delivered to the Americas, against RMB4,527.1 million of revenue produced by the Thai base [24]. The company does not cross-tabulate base against destination, so the overlap cannot be pinned exactly; but Americas revenue equals 86% of Thai-base revenue, and the duty regime on Chinese-origin product makes it unlikely that much of the Americas figure came from Shandong. The chapter therefore proceeds on the assumption that most Thai-base output is sold into the Americas and most Americas revenue is made in Thailand.
That business carries a duty stack that has been rebuilt three times in five years.
Sources: the FY2025 annual report's anti-dumping and countervailing duty disclosure for every entry through the EU cases [25] [26]; the April 2025 US tariff action as dated by Linglong's industry review [27]. The February 2026 and July 2026 entries are from public sources outside the corpus and are discussed below.
Two of these landed inside FY2025 for the first time. The 12.33% duty on Thai truck and bus tyres became final on 10 October 2024, so FY2025 was its first full year [28]. The US baseline and reciprocal tariffs took effect in April 2025 and applied to every origin [29]. The Report of the Directors is unusually direct about which mattered: the fall in profitability, it says, "was mainly due to an increase in the cost of sales resulting from North American reciprocal tariffs" [30]. That sentence, in the directors' own report, names one cause and it is not raw materials.
The production data agrees. Of the four base-and-product lines the company discloses, Thai all-steel fell furthest and was the only one to end the year below 90%: capacity utilisation dropped to 80.6% from 87.1%, which on 2 million sets of capacity is roughly 130,000 fewer truck tyres. Shandong all-steel went the other way, from 82.6% to 93.8% on 7.4 million sets, while the two semi-steel lines each gave up around five points from near-full utilisation [31]. The line that fell furthest is the line that acquired a new 12.33% US duty eleven weeks before the year began, while the domestic line ran nearly flat out on an OE order book that grew 73.9% by revenue [32].
The tax layer
The Thai advantage was never only a duty advantage. Prinx Chengshan Tire (Thailand) has been entitled to a full corporate income tax exemption since 2020, and its weighted average effective tax rate on accounting profit for FY2025 was 0% against a Thai statutory rate of 20% [33]. The tax reconciliation puts a number on that exemption every year, and the number has been growing: RMB39.8 million in FY2021, RMB99.7 million in FY2022, RMB98.0 million in FY2023, RMB156.2 million in FY2024 and RMB150.5 million in FY2025 [34] [35] [36]. Cumulatively that is RMB544.1 million of tax not paid over five years.
OECD Pillar Two took effect on 1 January 2025 and the group recognised a RMB70.9 million top-up charge for Prinx Thailand in the same year [37] [38].
Sources: the tax exemption of a subsidiary line in the tax reconciliations of the FY2025 [39], FY2024 [40] and FY2022 [41] annual reports.
Year one of Pillar Two therefore reclaimed 47% of the exemption's benefit, leaving RMB79.6 million. The top-up is smaller than a straight 15% floor on Thai accounting profit would imply, because the global rules exclude a slice of income tied to payroll and tangible assets, and the Thai plant is asset-heavy. At a 20% statutory rate, the FY2025 exemption line implies a Thai pre-tax profit of roughly RMB750 million — the only handle the filings give on that subsidiary's bottom line, and a derivation rather than a disclosure. The group's effective tax rate has moved from a credit in FY2021 and FY2022 to 8.6% in FY2023, 5.2% in FY2024 and 8.9% in FY2025 [42].
Pillar Two is a permanent floor, with no administrative review of the kind that has cut the anti-dumping rate three times, and the group states that it has been implemented in Thailand, Malaysia and Europe, which means the Malaysian base now under construction inherits it from the start [43].
What changed after the balance-sheet date
Three things have moved since 31 December 2025, and two of them run the group's way.
The reciprocal tariffs the directors named as the main cause of the FY2025 decline no longer exist. The US Supreme Court held them unlawful on 20 February 2026 and customs stopped collecting them from 24 February; those dates come from public reporting outside this corpus, but the fact is confirmed inside it — at Sailun's results meeting on 8 May 2026 an investor asked about refunds following the ruling, and Sailun answered that it had received none so far and that its Vietnamese and Cambodian plants' semi-steel and all-steel exports to the United States remain subject to a 25% rate under Section 232 [44]. The reciprocal layer is gone; the Section 232 layer, which is larger, is not. Sailun had earlier put the reciprocal rates at 19% for Cambodia and Indonesia and 20% for Vietnam, against Section 232 at 25% [45].
The Thai anti-dumping rate has fallen again. Commerce published the final results of the third administrative review on 20 July 2026, with Prinx Chengshan Tire (Thailand) among the respondents at 2.90%, against the 5.08% set in May 2025. The existence, date and respondent list of that notice are recorded in the corpus [46]; the rate itself is from the Federal Register text and is flagged as an outside source.
Running the other way, the European anti-dumping and countervailing cases are open against China-origin product, with import registration running since 22 January 2026 so that duty can be applied retroactively [47], which places that exposure on the Shandong base rather than the Thai one; the docket, the bound on the exposure and the Malaysian relief timetable are in Trade Docket 2026.
Thai base share of the gross-profit fall
Pillar Two top-up, FY2025 (RMB m)
Thai tax exemption, FY2021-FY2025 (RMB m)
Cost of the 6.69-point Thai margin fall (RMB m)
Sources: segment note [48] [49] and the tax exemption of a subsidiary line in the tax reconciliations [50] [51] [52]; the margin cost is the 6.69-point fall applied to FY2025 overseas revenue.
What would change the read
The evidence points to a FY2025 that was damaged by trade cost and a permanent tax change at one plant, not by an input cycle — and to a FY2026 in which the largest single component of that damage has already been removed by a court. On the arithmetic, restoring the Thai base to its FY2024 margin would be worth RMB302.9 million of gross profit at FY2025 overseas revenue, roughly 28% of last year's profit. The second half of FY2025 was already moving that way: with first-half attributable profit of RMB507.6 million reported by the trade press, the implied second half was about RMB580 million against about RMB500 million a year earlier [53], a point set out in more detail in Business.
The strongest fact against that read is the one the group put in its own risk section: Pillar Two does not reverse, the EU case is open against the Shandong base with retroactive registration already running, and the Thai plant's largest remaining US cost — the 25% Section 232 rate a peer describes as still in force — survived the Supreme Court ruling untouched [54] [55]. The duty on Thai passenger tyres has been 17.06%, 4.52%, 5.08% and now 2.90% across five years, so the Thai margin moves with review outcomes the company does not set and is better held as a range than as a level.
Two disclosures would settle the argument, and the company makes neither. A split of the FY2025 cost of sales showing duty separately from raw materials would end the attribution question in one table. A base-by-destination revenue cut would convert the 86% overlap between Americas revenue and Thai-base revenue from an inference into a fact. Until then, the segment note plus the peer purchase-price tables are the best available substitute, and they say the same thing. The next event to watch is the EU determination, and it lands on the Shandong side of the group — where the capital commitment stands at RMB745.3 million against RMB77.8 million a year earlier, mostly for Malaysia and the off-the-road project [56].
One note on timing worth carrying forward: the Report of the Directors is dated 30 March 2026 [57], five weeks after the reciprocal tariffs it identifies as the main cause of the profit decline had been struck down and collection had stopped. The report covers FY2025 and is not obliged to update FY2026; on its 30 March 2026 signing date, the cost it names as the main cause of the decline was no longer being collected.
What the market pays
Bottom line. At HK$6.82 the equity is worth about RMB3,911 million — 3.6 times FY2025 earnings, 0.54 times closing book value, and roughly two times the company's own EBITDA measure net of cash. Those multiples hold up under the stresses this chapter builds from the filings: removing the Thai tax exemption and the whole Thai margin premium, and taxing what remains at the full PRC rate, still leaves 5.7 times. The valuation is far less sensitive to the earnings level than to the claim on the cash those earnings produce.
Prinx Chengshan earned RMB1,087.6 million attributable to shareholders in FY2025 and RMB1,311.8 million in FY2024, or RMB1.71 and RMB2.06 per share [1]. The shares closed at HK$6.815 on 3 August 2026 [2], against 638,645,000 shares in issue at 30 March 2026 [3]. Every conversion below uses HK$1 = RMB0.9032, the rate implied by the company's own translation of its proposed final dividend — HK$319,323,000 stated as RMB288,419,000 [4].
Price / FY2025 earnings
Price / closing book
Free cash flow yield
Yield on FY2025 final dividend
Source: derived from the FY2025 closing price [5], reported earnings and equity [6] [7], and the proposed final dividend [8]. Market capitalisation of HK$4.33 billion at 3 August 2026.
Equity attributable to shareholders closed FY2025 at RMB7,189.5 million, on which the company reports a return on equity of 15.8% and an asset-to-liability ratio of 38.8% [9]. Book value works out at RMB11.26 per share, or HK$12.46 — roughly 1.8 times the traded price. The balance sheet carries net cash on any measure: the audited capital-management note nets RMB682.9 million of bank borrowings and RMB29.9 million of lease liabilities against RMB1,034.9 million of cash and RMB64.9 million of restricted cash, for net cash of RMB387.0 million and a gearing ratio of -5.7% [10]. The run's shared financial series puts net cash higher, at RMB643.4 million, because it nets only non-current bank borrowings; the company's own measure is the stricter one and is used here, with one further adjustment noted below.
On enterprise value, the arithmetic is unusually compressed. Taking the company's RMB387.0 million of net cash, enterprise value is about RMB3,524 million against EBITDA of RMB1,767.5 million [11] and profit before income tax of RMB1,194.4 million [12] — 1.99 times EBITDA and 2.95 times pre-tax profit. One adjustment cuts the other way: the RMB230.0 million three-year loan from Chengshan Group sits in non-current liabilities and is not in the company's borrowings total [13]. Counting it as debt and adding the RMB153.4 million of wealth-management assets held at fair value [14] leaves net cash of RMB310.4 million and moves EV/EBITDA from 1.99 times to 2.04 times. The measure barely matters at this level.
What the multiple survives
A multiple this low is only informative if the earnings behind it survive being taken apart. The report has already established that a large share of the FY2023–FY2025 profit level rests on a spread earned at one plant (Thailand Margin and Tax). The useful test is to remove that spread, in stages, and see where the multiple lands.
The first stage removes the Thai tax advantage entirely. Prinx Thailand's income tax exemption reduced the group's FY2025 tax charge by RMB150.5 million, against which the first-year Pillar Two top-up took back RMB70.9 million, leaving a net benefit of RMB79.6 million [15]. Strip it and FY2025 profit becomes RMB1,008 million.
The second stage removes the Thai operating advantage as well. The Shandong base earned a 15.79% gross margin in FY2025 against Thailand's 21.83% — the domestic and overseas segments respectively [16]. Applying the Shandong margin to the whole group removes RMB273.5 million of gross profit; taxing what remains at the 25% PRC statutory rate rather than the 8.9% the group actually paid leaves about RMB691 million of profit. That version of the business has no offshore margin premium, no tax exemption and no duty arbitrage, and it is capitalised at 5.7 times.
Source: derived from FY2025 reported profit [17], the tax reconciliation [18] and segment margins [19]. Scenarios are arithmetic stress cases, not forecasts.
The same arithmetic run backwards gives the earnings level the current price is consistent with. Discounting a flat, perpetual earnings stream at 10% would make RMB3,911 million of market value consistent with RMB391 million of sustainable earnings — 36% of what FY2025 actually produced. At 12% the implied figure is RMB469 million, or 43%; at 15%, RMB587 million, or 54%. Even the harshest of the three sits below the RMB691 million that survives stripping out Thailand's margin and its tax status together. The gap between those two numbers is the margin of safety on offer.
The listed comparison
Five Chinese tyremakers with filings in this corpus are listed in Shanghai or Shenzhen; Prinx Chengshan is the only one listed in Hong Kong. Their FY2025 results are filed under PRC accounting standards rather than IFRS, and the competitive-model differences are set out on the Competition tab. No market price for any of the five is on this run's record, so the comparison below is of filed profit against filed net assets — returns, not multiples, and not business quality.
Sources: FY2025 profit attributable to shareholders and closing net assets from each company's own annual report — Sailun [20], Linglong [21], Triangle [22], Guizhou Tyre [23], Jiangsu General Science [24]; Prinx Chengshan from its own FY2025 report [25] [26]. Peer figures are PRC GAAP; returns use closing rather than average equity. No market price for the five mainland-listed peers is on this run's record, so no multiple is shown against their earnings or their book.
Four of the five peers earn between 3.2% and 6.8% on their closing equity. Only Sailun earns a return comparable to Prinx Chengshan's, 16.3% against 15.1% on the same measure. What the market pays for those returns cannot be established here: no peer price series exists in this run, so the multiple comparison the sector is usually judged on is not available and is recorded as an open question.
Sources: as the table above — peer annual reports [27] [28] [29] [30] [31] and equity attributable to shareholders from the FY2025 annual report [32]. Returns are FY2025 profit attributable to shareholders over closing net assets, PRC GAAP for the five mainland peers.
There is a longer-dated version of the same observation. The company listed in October 2018 at an offer price expected to be between HK$5.89 and HK$7.50 [33]. In the last full year before that listing it earned RMB173.6 million on revenue of RMB4,840.4 million [34]. Revenue is now 2.4 times that level and profit 6.3 times [35], and the shares trade inside the 2018 range.
What the cash actually buys
The gap between the earnings multiple and the cash multiple is where the case gets harder. Operating cash flow was RMB1,201.2 million in FY2025, capital expenditure on property, plant, equipment, land use rights and intangible assets RMB581.5 million, and free cash flow therefore RMB619.7 million — 57% of reported profit [36]. The 27.8% earnings yield is arithmetic; the 15.8% free cash flow yield is what the business actually produced, and the receivable build behind the difference is set out in Business.
That free cash flow is now spoken for. Capital commitments contracted but not provided for stood at RMB745.3 million at 31 December 2025, against RMB77.8 million a year earlier [37]; that is more than a year of free cash flow at the FY2025 rate, and the Malaysian and off-the-road programme those contracts lead into is set out with its timetable and its returns in Return on Capital.
A second constraint sits at the holding company. Reserves available for distribution were RMB2,186.9 million at 31 December 2025, down from RMB2,308.9 million a year earlier [38]. That is 7.6 times the proposed final dividend and about 30% of consolidated equity — ample for the current payout, and a real ceiling on any larger return of capital.
Sources: FY2021 and FY2020 dividends [39], FY2023 and FY2022 [40], FY2024 [41] and the FY2025 final dividend proposed at RMB288.4 million [42]. Payout is the final dividend as a share of profit attributable to shareholders; the FY2024 interim dividend of HK$0.15 per share is excluded [43].
The proposed FY2025 final dividend of HK$0.50 per share is 26.5% of attributable profit, comfortably above the prospectus commitment to distribute at least 20% of distributable net profit [44], and it has been paid without interruption for five years. Two details qualify the headline yield. The record date was 30 July 2026 [45], so the 3 August price is already ex that dividend; the HK$0.77 decline between 24 and 28 July spans the ex-date [46]. And the company withholds 10% PRC enterprise income tax on distributions to non-resident enterprise shareholders, a category that expressly includes HKSCC Nominees and other corporate nominees [47] — which is to say almost every foreign holder. A 7.3% gross yield is a 6.6% net one.
One piece of evidence runs the other way on capital discipline, and it sits with the rest of the project ledger in Return on Capital.
Why it trades here
Three mechanical facts explain a good deal of the discount without touching the business at all.
There is effectively no sell-side coverage. No aggregator carries a live consensus estimate or price target for the stock; the most recent genuine broker target located is HK$8.61 from a small Hong Kong house dated 11 July 2025, and no rating action has been recorded since 31 March 2025 [48]. That target was itself set on 4.8 times forecast earnings, so even the standing bull case does not underwrite a re-rating far past five times.
There is very little tradeable stock. Volume over the twenty sessions to 3 August averaged 68,075 shares, about HK$0.49 million a day; over sixty sessions, HK$0.76 million. Annual turnover runs at roughly 8% of shares outstanding. A position worth 0.5% of the market capitalisation — HK$21.7 million — would take about 234 trading days to exit at 20% of average daily volume. The controlling family holds 70.35% of the votes and, as the People tab records, only about 16% of the register is genuinely dispersed.
And the earnings have a visible policy dependency. The FY2025 result absorbed a Pillar Two top-up in its first year of effect and a duty ladder that has moved four times in five years (Thailand Margin and Tax). A stream that can be repriced by a foreign tax authority is worth less than one that cannot, whatever the multiple.
Source: month-end closes drawn from the daily price record, August 2025 to August 2026 [49]. The July 2026 step down spans the ex-dividend date for the HK$0.50 final dividend.
The shares reached HK$8.33 in January 2026 and have given back 18% since, with the sharpest legs in June and late July 2026. Part of the July move is the dividend. The rest coincides with a period in which the FY2025 report was digested and the European anti-dumping and countervailing investigations remained open against the Shandong base.
The read
The evidence points to a discount wider than the identified risks account for. The business earned 15.1% on closing equity in a year it describes as damaged, holds net cash, has paid a dividend every year since listing, and is priced at 3.6 times those earnings and 0.54 times that book; of the five mainland-listed peers only Sailun earns a comparable return, and none of their prices is on this run's record. Removing the Thai tax exemption and the entire Thai margin premium, and taxing the remainder at the full PRC rate, still leaves the shares at 5.7 times.
The strongest fact against that read is that the cash is not the shareholder's to discount. Free cash flow of RMB619.7 million is 57% of reported profit [50]; contracted capital commitments already stand at RMB745.3 million [51]; a quarter of profit is distributed and the rest is reinvested at returns the company has never reported against its own 2018 hurdle of a 10% internal rate of return, as the History tab records. In FY2025 the group also bought RMB27.4 million of its own shares — for the employee share award trust, not for cancellation — while borrowing RMB230.0 million from its controlling shareholder [52]. A minority holder has no mechanism to close the gap and no buyback to lean on.
Two disclosures would move the read materially. A segment or project return reported against the 10% hurdle — for Thailand, and then for the Malaysian base being built on the same logic — would convert the reinvestment risk from unknown to measurable. And the FY2026 interim, due around late August 2026 [53], will show whether the Thai segment margin recovers toward its FY2024 level now that the reciprocal-tariff layer has come off. A definitive European duty landing on the Shandong base before the Malaysian plant reaches capacity would push the argument the other way, and would do so against the semi-steel line that was RMB4,936.1 million, or 41.8% of group revenue, in FY2025 [54].
The hurdle and the record
Bottom line. Prinx Chengshan set itself a written investment hurdle in 2018 — a 10% internal rate of return and a payback of no more than ten years — and has never reported a single project against it. The completed capital cleared it: return on capital employed has averaged 14.2% since FY2017. The two projects now absorbing roughly RMB3.2 billion are underwritten, on management's own stated figures, at about half the revenue per unit of capital the last four projects delivered.
The 2018 prospectus is the only document in the corpus that states an investment standard. "We currently seek to invest in projects with internal rates of return of no less than 10%, and payback periods of no more than 10 years," it says, alongside the feasibility-study criteria the company applies before committing [1]. It also defines what payback means at this company: the time for a project's accumulated revenue to cover its accumulated direct expenses plus its capital expenditure [2]. That is a gross-profit test, not a cash-flow test, and it is the yardstick used throughout this chapter because it is the company's own.
The prospectus then applied that yardstick to three named projects: an all-steel expansion of 2,000,000 units in two phases costing RMB496.5 million and RMB650.7 million, with paybacks of 2.5 and 3.5 years [3] [4], and a semi-steel expansion of 2,250,000 units costing RMB460.9 million with a payback of 4.8 years [5]. Nothing in the eight years since has been reported against either the hurdle or those estimates; the dated promise-and-delivery ledger sits in History. What the filings do give, project by project, is a stated total investment and a stated capacity or output value. That is enough to rebuild the arithmetic.
What the completed capital earned
Return on capital employed — operating profit before net finance costs divided by total assets less current liabilities — is computable for every year from FY2017 using the company's own five-year summaries and its own EBIT margin definition.
Source: derived from revenue and EBIT margin, and from total assets less current liabilities, in the five-year summaries of the FY2021 [6] [7] [8] and FY2025 [9] [10] [11] annual reports. The hurdle line is the 10% internal-rate-of-return floor stated in the 2018 prospectus and is not a return-on-capital-employed target.
The nine-year average is 14.2%. Two consecutive years sat below the hurdle — 4.8% in FY2021 and 7.1% in FY2022, when the group was carrying the freshly completed Thai and Shandong capacity through a gross margin that had fallen to 13.8% [12]. Both years sit between the completion of the Thai and Shandong lines and the arrival of their volume: the new capacity was in capital employed and in the depreciation charge before it was in revenue.
The incremental arithmetic points the same way. Between FY2018, the last full year before the Thai construction began, and FY2025, capital employed rose from RMB3,098.3 million to RMB7,950.5 million while EBIT rose from RMB567.5 million to RMB1,216.1 million [13] [14] [15]. EBIT here is operating profit before net finance costs, which puts the FY2025 figure RMB21.7 million above the profit before income tax of RMB1,194.4 million cited in Business. That is RMB648.6 million of additional operating profit on RMB4,852.2 million of additional capital — 13.4%, measured to a duty-hit year. Measured to FY2024 it is 21.9%. On the asset side, non-current assets rose RMB3,867.9 million between FY2018 and FY2025 while revenue rose RMB6,600.7 million [16] [17]: RMB1.71 of annual revenue for every RMB1 of net fixed-asset growth.
The project ledger
Every new production line the group has announced since listing carries a stated cost and a stated capacity. Applying FY2025 realised prices — RMB793.5 per all-steel set and RMB241.9 per semi-steel set, from revenue of RMB6,664.2 million and RMB4,936.1 million on volumes of 8.40 million and 20.40 million sets [18] [19] — gives each project an annual revenue at full capacity on a common price deck. For the two current projects no such derivation is needed: management states the output value itself.
Sources: the 2018 prospectus for the two IPO expansions [20] [21]; the FY2021 annual report for the Shandong and Thailand phase II total investment amounts [22]; the FY2023 annual report for the Thailand phase III total investment [23]; and the FY2025 annual report for the Malaysian and off-the-road total investment and output values [24] [25]. Revenue at full capacity is derived at FY2025 realised prices for the six completed projects [26] [27] and is management's stated output value for the two current ones. Malaysia is converted at CNY 7.10 to the US dollar throughout. Payback is stated investment divided by annual gross profit at the FY2025 group gross margin of 18.1%. The RMB120.0 million Shandong capacity optimisation approved in 2023 is excluded: it is a technological upgrade of an existing line rather than a new one [28].
The six completed projects range from 1.08 to 2.41 times revenue per unit of capital. The two under construction sit at 0.90 — Malaysia at a stated USD299 million cost against a stated USD270 million of annual output value [29], and the off-the-road project at RMB1.11 billion against RMB1.0 billion [30].
Source: as for the project ledger above — the prospectus and the annual reports for the stated total investment and production capacity of each project [31] [32] [33] [34] [35], with revenue derived at FY2025 realised prices [36] [37].
The gap is a capital-cost gap, not a revenue gap. Applying the group's own FY2025 prices to Malaysia's planned 6.0 million semi-steel and 0.6 million all-steel sets gives RMB1,927.8 million of revenue, or USD271.4 million at CNY 7.10 — within half a percent of the USD270 million management publishes [38] [39]. The revenue side of the plan is the current price deck applied to the planned capacity. The cost side is where Malaysia differs: USD299 million buys 6.6 million sets, or about RMB322 per set of annual capacity, against RMB276 per set for the Thai phase II build [40]. Matched to Malaysia's actual product mix, Thai phase II unit costs would have built the Malaysian plant for about RMB1,614 million, or USD227 million — 24% below the stated figure, which is the same thing as a 32% premium on the Thai cost base. The gap is unexplained in any filing. Two obvious candidates are that Kedah is a greenfield site where Thai phase II was an expansion inside a running base, and that six years of equipment prices separate them; neither is quantified anywhere.
The direction of travel has been favourable. The FY2024 annual report put the Malaysian project at USD380 million for the same capacity and the same USD270 million of output value [41]. The 21% cut disclosed a year later moved revenue per unit of capital from 0.71 to 0.90 — the single largest change to the project's economics since it was announced, and the filings give no reason for it.
What the payback needs
Because both projects come to almost exactly 0.90 times, they need the same operating margin to clear the same hurdle. A ten-year payback on the company's own definition requires annual gross profit of a tenth of the investment: USD29.9 million on Malaysia's USD270 million of output, and RMB111 million on the off-the-road project's RMB1.0 billion. Both work out to a gross margin of 11.1%.
Gross margin needed for a 10-year payback
Payback at a 15% gross margin (yrs)
Payback at a 20% gross margin (yrs)
Committed programme (RMB m)
Source: derived from the stated investments and output values for the Malaysian and off-the-road projects [42] [43], applying the payback definition in the 2018 prospectus [44] and the forecast gross-margin band in the FY2025 goodwill impairment note [45].
Management publishes its own forward margin band. The FY2025 goodwill impairment test assumes a gross margin of 15% to 20% of revenue over the five-year forecast period, with the note explaining that expected rubber price rises are not assumed to be passed on to customers [46]. At the bottom of that band the two projects pay back in 7.4 years; at the top, 5.5. Both are inside the ten-year hurdle, and both are roughly double the 2.5-to-4.8-year paybacks the prospectus attached to the projects it was raising money for [47].
Gross profit is a generous numerator: it carries no selling, administrative or research cost and no tax. Substituting the group's EBIT margin — 10.3% in FY2025, 13.2% in FY2024 [48] — stretches the payback on both projects to between 8.4 and 10.8 years. The hurdle is cleared on the company's own measure and is a close-run thing on any stricter one.
The 10% return floor also sits oddly against the discount rate the company applies to its own cash flows. The same impairment note discounts the operating segment's forecasts at a pre-tax rate of 18% [49]. The two numbers do different jobs — one is an eight-year-old investment screen, the other a current valuation input for an existing cash-generating unit — but a project approved at 10% and a business valued at 18% cannot both be right about the cost of this company's capital, and no filing reconciles them.
What Malaysia does not inherit
Thailand's return was never purely industrial. The Thai subsidiary's full corporate income tax exemption reduced the group's tax charge by RMB544.1 million cumulatively across FY2021 to FY2025, quantified year by year as a reconciling item in the tax notes of the FY2021 [50], FY2023 [51] and FY2025 [52] annual reports and set out in Thailand Margin and Tax. Malaysia begins on the other side of that change. The FY2025 report states that Pillar Two has been officially implemented in Thailand, Malaysia and Europe, imposing a uniform 15% effective rate on multinational groups above the EUR750 million revenue threshold, and that subsidiaries whose effective rate falls below 15% because of local incentives face top-up tax [53]. Whatever incentives Kedah Rubber City carries, the floor applies from the plant's first profitable year. The five years of untaxed Thai profit that flattered the group's post-2020 returns are not available a second time.
The off-the-road project carries a different kind of uncertainty: it is a product the company has never manufactured at scale. Its published unit plan also moved. The FY2024 report described 840,000 high-performance engineering radial tyres a year alongside 10,000 giant tyres, at a total investment of RMB1.17 billion in the chairman's statement [54] and RMB1.11 billion in the same report's management discussion [55]; the FY2025 report describes 84,000 and 10,000, at RMB1.11 billion [56]. The tonnage target — 50,000 tonnes a year by 2029 — is identical in both reports, and only the smaller unit count is consistent with it: 94,000 tyres at 50,000 tonnes implies an average of about 530 kg, which is the right order for engineering radials, while 850,000 tyres would imply under 60 kg, which no engineering tyre approaches. The FY2024 figure was a misprint rather than a scope change, and the arithmetic of the project is unaffected. What is affected is the reader's ability to take a published capacity number at face value; the same restatement is logged in History. Trial production began in the fourth quarter of 2025 and the first 30.00R51 giant tyre came off the line on 19 January 2026 [57].
The claim on cash, and the timing
Very little of the programme is in the ground. Construction in progress stood at RMB259.2 million at 31 December 2025 against RMB184.0 million a year earlier, and prepayments and other non-current assets rose RMB67.2 million to RMB113.2 million on land and equipment for Malaysia [58] [59]. Contracted capital commitments jumped from RMB77.8 million to RMB745.3 million in a single year [60]. Against a total programme of roughly RMB3,233 million, the bulk of the spend falls between 2026 and 2029 — Malaysia's capacity releases across 2027 and 2028, the off-the-road plant reaches design capacity in 2029 [61] [62].
Spread evenly across those four years, that is about RMB808 million a year on top of maintenance. FY2025 capital expenditure was RMB577.3 million on property, plant, equipment and land use rights, against a depreciation charge of RMB500.9 million and operating cash flow of RMB1,201.2 million [63] [64]. The programme alone absorbs roughly two-thirds of current operating cash flow for four years, and adding it to a replacement-level base takes total capital expenditure past that cash flow, which is the mechanism behind the free-cash-flow constraint set out in Valuation and Discount.
Where this read could break
On the evidence, the reinvestment record supports the reinvestment. Return on capital employed has averaged 14.2% over nine years and 20.4%, 20.4% and 15.3% in the last three; the incremental return on the capital added since FY2018 is 13.4% measured to a duty-hit year. What is different about the current programme is the underwriting: 0.90 times revenue per unit of capital against 1.08 to 2.41 for the six projects that preceded it, an unexplained 32% cost premium per set of capacity over the last comparable build, and a tax leg that Pillar Two closes before the Malaysian plant opens.
The strongest fact against that read is that the group has already cut the Malaysian budget once, by 21%, which moved the project from 0.71 to 0.90 times without touching the output plan [65] [66]. The same discipline appears in what was not built: the Anhui project, whose first phase the board approved on 31 August 2021 at an expected total investment of RMB3,000.0 million for 800,000 all-steel and 5 million semi-steel sets [67], ended with the subsidiary carrying paid-in share capital of RMB0 against RMB378.0 million registered and being liquidated on 19 August 2025 [68]. Nothing was ever funded. A management team that walks away from a project of that size, and re-costs another by a fifth before pouring concrete, is not spending indiscriminately.
Three disclosures would let the reinvestment record be tested directly, and none of them is in the filings: the return earned at each production base, a project result measured against the 2018 standard, and the Malaysian tax position. The segment note allocates revenue, gross profit and non-current assets by production base but no operating expense, depreciation, capital expenditure or capital employed [69] [70], so the return on the RMB2,965.7 million of overseas non-current assets that the Thai base dominates can be bounded but not computed. No project has ever been reported against the 10% and ten-year standard. And no filing states the Malaysian tax position under the incentives the group has negotiated. Two dated events would move the read sooner: Malaysian trial production in the fourth quarter of 2026, which fixes the first capital cost against the USD299 million estimate, and the first year in which the off-the-road line runs at commercial volume, which is the first observation of the gross margin that the payback arithmetic assumes.
The two channels
Bottom line. Between FY2021 and FY2025 the controlling shareholder collected RMB1,041.5 million from the company as a supplier and lessor, against RMB862.2 million of dividends paid to every shareholder together. The largest of those flows — RMB963.6 million of utilities — has had no disclosed pricing basis, annual cap or independent review since a 2018 agreement expired at the end of 2020. What can be measured on that channel is worth roughly 3% to 6% of profit a year.
Cash leaves Prinx Chengshan for its controlling shareholder along two roads. One is the dividend, which is pro-rata: Chengshan Group Co., Ltd. holds 68.36% of the shares directly and a further 1.99% through Chengshan Trade (Hong Kong) Limited, so it receives 70.35% of whatever the board declares and the other 29.65% goes to everyone else [1]. The other is the purchase ledger, which is not pro-rata at all: every renminbi the company pays Chengshan Group for utilities, rent and services belongs to Chengshan Group alone.
Over five years the purchase channel carried more cash than the dividend. The company paid RMB963.6 million to Chengshan Group for utilities and a further RMB77.9 million in rent, estate management and a right-of-use asset purchase — RMB1,041.5 million in all [2] [3] [4] [5] [6]. Over the same five years the company paid RMB862.2 million of cash dividends to all shareholders combined [7] [8] [9] [10] [11]. At the roughly 70% holding the controller has carried throughout, about RMB604 million of the dividend reached Chengshan Group and about RMB258 million reached everybody else.
All figures RMB million. Purchases from Note 36 Related Party Transactions in each year — FY2025 [12], FY2024 [13], FY2023 [14], FY2022 [15], FY2021 [16]; dividends from each year's consolidated statement of cash flows [17] [18] [19] [20] [21]. Dividend split derived at a flat 70% controller holding; the actual holding rose from 69.43% to 70.35% over the period. Energy-management services, disclosed on a different basis before FY2024, are excluded from this table and discussed below.
The FY2025 columns make the point without any five-year aggregation. The company paid Chengshan Group RMB216.1 million for utilities that year and RMB285.0 million of dividends to all holders, of which the controller's share was about RMB199.5 million. Chengshan Group received more cash from the company as a utility supplier than as its 70.35% owner.
Sources: purchases of utilities from Note 36 of the FY2021 to FY2025 annual reports [22] [23]; dividend share derived from cash dividends paid at a flat 70% holding [24].
The utility line
Utilities are a real input, not a bookkeeping device. The 2018 prospectus is explicit that the Shandong plant does not generate its own power: "We do not maintain our own thermal power station," and utilities ran at 5.4% of cost of goods sold in 2017 [25]. Steam and electricity for a tyre plant of this size are a large recurring bill by nature, and the size of the number is not by itself evidence of anything.
The pricing basis is the part that has lapsed. On 1 January 2018 the Shandong subsidiary entered a Utility Charge Agreement under which it would pay Chengshan Group for shared electricity at cost, calculated on charges actually incurred plus taxes under price guidance issued by the Rongcheng Power Supply Bureau. The prospectus adds two facts that cut in the group's favour: Chengshan Group had negotiated a discount on the standard tariff that during the track record period ran about 10% below the standard electricity rate, and the group has independent access to electricity if it needs it [26]. Because the arrangement was a sharing of services on a cost basis, it qualified as a fully exempt continuing connected transaction under Rule 14A.98 of the Listing Rules [27].
That agreement ran from 1 January 2018 to 31 December 2020. No annual report from FY2021 to FY2025 mentions its renewal, its successor, its term, or the cost basis. What each report does carry is one line in Note 36 giving the amount, and one sentence in the Report of the Directors stating that the purchase of water and electricity from Chengshan Group is "fully exempt from the disclosure requirements under Chapter 14A of the Listing Rules" [28]. The exemption is asserted; the cost basis that earned it in 2018 is not restated.
The governance is inverted relative to size. The two continuing connected transactions that do get the full treatment — annual caps, independent non-executive director review and an auditor letter — are the energy-management contract at RMB10.7 million against an RMB11.0 million cap and property services at RMB6.4 million against an RMB6.8 million cap [29]. Together they come to RMB17.2 million. The utility purchase, at RMB216.1 million, is twelve and a half times larger and carries none of it. Nor does it appear as a separate line anywhere else: the expenses-by-nature note running to RMB10,683.6 million of total expenses has no utilities or energy caption, so Note 36 is the only place the figure is visible at all [30].
What is at stake is bounded and modest. Against FY2025 profit attributable to shareholders of RMB1,087.6 million, a 5% overcharge on RMB216.1 million would be RMB10.8 million, or 1.0% of profit; 10% would be RMB21.6 million, or 2.0%; a 25% overcharge would be RMB54.0 million, or 5.0% [31]. Those are the magnitudes; none of them is a threat to the earnings power the rest of this report has traced. The issue is that the cost basis which would let a shareholder rule out even the largest of them was published once, in 2018, for an agreement that expired six years ago.
Votes and economics
The voting stake and the look-through economic interest behind it are different numbers. On votes, 70.35% sits with Chengshan Group and its Hong Kong subsidiary, in a single share class (People carries the full control map). On economics, the corpus supports a range rather than a number, and the range is wide.
Two disclosures bound it. The first is the chain the shareholding notes trace: Che Baozhen and Li Xiuxiang each own 50% of Shanghai Chengzhan, which owns 95% of Beijing Zhongmingxin, which controls 39.79% of Chengshan Group [32]. That chain carries 37.80% of Chengshan Group, and therefore 26.6% of the listed company. The second sits in the first note of the financial statements, which the prior tabs did not reach: Chengshan Group "is ultimately held as to 69.15% by Mr. Che Baozhen and his spouse, Ms. Bi Wenjing, Mr. Che Hongzhi and his spouse, Ms. Li Xiuxiang (collectively the 'Controlling Shareholders') and other individual shareholders" [33]. That 69.15% is a ceiling, not the family's stake, because the sentence explicitly folds other individual shareholders into the same block. Multiplied through the 70.35%, it caps the family's look-through economic interest at 48.6%.
Sources: FY2025 substantial shareholders table [34] and shareholding notes [35]; the FY2025 accounts' statement of the 69.15% ultimate block [36]; the FY2021 accounts' statement of the same block at 76.43% [37]. Rows 2 and 4 are ceilings, not point estimates, because each ultimate block includes unnamed individual shareholders.
That ceiling moved once, and the filings do not say why. The FY2021 accounts put the ultimate block at 76.43%; from FY2022 onward every report states 69.15% [38] [39]. Against the listed-company holding of each year, the ceiling on family economics fell from about 53.1% to about 48.6% while the voting block rose from 69.43% to 70.35%. A 7.3-point change in the ownership of the immediate holding company is not a rounding adjustment, and no annual report narrates it.
The wedge this creates is specific, and it is what makes the purchase ledger above worth reading carefully. Whoever else sits on the Chengshan Group register receives none of the listed company's dividend, but takes a share of everything routed through Chengshan Group as a supplier or lessor. Cash paid as dividend is split 70.35 / 29.65 between the controller and the market. Cash paid through the purchase channel is split entirely inside Chengshan Group, among a register the listed accounts do not name.
The loan at 3%
In FY2025 Chengshan Group lent the group RMB230.0 million at a fixed 3% for three years [40]. The RMB2.677 million of interest charged during the year implies about 4.7 months of elapsed term, so the money was drawn around the middle of August [41]. It shows in financing activities alongside RMB1,548.4 million of bank drawdowns and RMB1,605.8 million of repayments [42].
Three percent is not a concessionary rate here. At 31 December 2025 the weighted average effective interest rate on the group's bank borrowings was 2.70%, down from 3.34% a year earlier [43]. The controller lent at 30 basis points above what the banks were charging, into a balance sheet that closed the year with RMB1,034.9 million of cash and equivalents against RMB682.9 million of total bank borrowings [44] [45]. The spread costs the company about RMB0.7 million a year, which is immaterial against RMB1,087.6 million of profit.
The comparison deserves one qualification, and it is a real one: 2.70% is a year-end weighted average across a book that is mostly short-dated, while the related-party loan is three-year fixed money. Term-matched, 3% may well be competitive or better. What the filings do not supply is any statement of purpose. A company holding net cash, funding replacement-level capex from operations and proposing a RMB288.4 million final dividend took on a new three-year obligation to its controlling shareholder, and no note explains what it funds.
Sinotruk on both sides of the trade
The second shareholder relationship runs the other way. Sinotruk (Hong Kong) Capital Holding Limited holds 8.59% of the shares [46], holds a board seat, and is the group's largest single customer. In FY2025 sales to Sinotruk rose 85.9% to RMB738.5 million while the receivable from Sinotruk rose 212.1% to RMB511.3 million [47] [48].
Sources: Sinotruk sales and receivable from Note 36 [49] [50]; group revenue from the consolidated statement of profit or loss [51]; group gross trade receivables of RMB1,975.8 million from Note 22 [52] plus RMB548.4 million of related-party trade receivables [53], which the balance sheet reports on a separate line [54].
One customer at 6.3% of revenue holds 20.3% of the group's trade receivables. On sales for the year, the RMB511.3 million balance is 253 days of Sinotruk revenue, against the 70 days of trade-receivable turnover the company reports for the group as a whole [55].
The company's own ageing table is the counter-fact, and it is a strong one: RMB551.0 million of the RMB553.4 million related-party balance is one to three months old by invoice date, with only RMB2.3 million in the four-to-six-month bucket [56]. Nothing is overdue on the company's own reckoning. The 253-day figure is therefore a statement about how heavily these sales landed in the closing months of the year rather than evidence of slow payment — but it also means the balance was funded by the group for the whole of that period, at a carrying cost of roughly RMB13.8 million a year at the group's 2.70% borrowing rate.
The structural point is that none of this passes through a connected-transaction review. Sinotruk has sat below the 10% substantial-shareholder threshold that defines a connected person under the Listing Rules for the whole period covered here, and its holding has been drifting down — 9.69% in FY2021, 9.65% in FY2022 and FY2023, 8.62% in FY2024 after a sale of about 6.5 million shares, 8.59% now [57] [58] [59]. The largest customer relationship in the group, and the largest single receivable, therefore sit outside the caps and independent review that cover RMB17.2 million of property and energy services.
The other side of the ledger
A controller can be measured by what it has not done as much as by what it has taken, and on that test the record is clean.
It has not sold. Chengshan Group's combined interest rose from 69.43% to 70.35% over the five years, which means the family bought while the second-largest holder was reducing. It has not diluted anyone: there has been no placement, no rights issue and no share issuance beyond the employee schemes, with the share count essentially flat at 638.6 million. It has not injected assets: the only capital transfer from the controller into the listed company across five years was the RMB24.9 million of right-of-use assets recognised on the 2024 property lease [60]. The dated founding record, including the family's repurchase of Cooper's stake before listing, sits in History.
Nor has management been paid for results it did not deliver. Options granted under the 2021 scheme were forfeited on missed performance targets, a ledger People carries in full, and RMB38.2 million of previously recognised expense was reversed through profit and loss [61] [62]. Total key management compensation, covering directors and senior management together, was RMB20.7 million of cash and RMB1.6 million of share-based expense — RMB22.3 million against RMB1,087.6 million of profit, or 2.05% [63]. The only share purchases on the market were the 4,000,000 shares the 2024 award-scheme trustee bought for employees at a cost of RMB27.4 million [64] [65].
And the dividend was defended. Profit attributable fell 17.1% in FY2025, yet the proposed final dividend was held at HK$0.50 per share, HK$319.3 million against HK$318.7 million a year earlier [66]. Holding a pro-rata payment flat through a down year is the one action on this list that pays the minority and the controller in exactly the same proportion.
Measurable annual value at issue (RMB m)
As a share of FY2025 profit
Key management pay as a share of profit
Derived: a 10% utility overcharge (RMB21.6 million) plus the loan spread (RMB0.7 million) plus the Sinotruk receivable carry (RMB13.8 million), rounded, against FY2025 profit attributable of RMB1,087.6 million [67]; key management compensation from Note 36 [68].
What the channel is worth
Adding the measurable pieces together: a 10% overcharge on utilities at RMB21.6 million, the loan spread at RMB0.7 million, and the funding cost of the Sinotruk receivable at RMB13.8 million come to about RMB36 million a year, or 3.3% of FY2025 profit. Pushing the utility assumption to a 25% overcharge takes the total to about RMB69 million, or 6.3%. Those are the outer edges of what the disclosed record can support.
The read this supports is narrow. The related-party channel at Prinx Chengshan is real, it runs mainly through one uncapped line, and on any assumption the filings can bear it is worth a low single-digit percentage of profit — not enough to explain a share trading at 3.6 times earnings and 0.54 times book (Valuation and Discount). Governance is not where the discount comes from.
The strongest fact against that read is the one this chapter could not close. The bound above rests on an assumption about utility pricing, not a disclosure: the only cost basis ever published expired at the end of 2020, and RMB963.6 million has passed through that channel since without a cap, an independent review or an auditor letter. A shareholder cannot currently verify the assumption that makes the number small. A renewed utility agreement with a stated cost basis and an annual cap, brought inside the same Chapter 14A review that already covers the RMB17.2 million of property and energy services, would settle which end of the RMB36 million to RMB69 million range applies and would bound the RMB216.1 million line the way the RMB17.2 million is already bounded. Until it exists, the 3.3% to 6.3% span above is an assumption rather than a measurement.
The European case on the record
Bottom line. The European case that was open when the FY2025 report was signed is still open on the record this run can see. The European Union began an anti-dumping investigation into Chinese car and light-truck tyres on 21 May 2025 and a countervailing investigation into the same product on 6 November 2025; the Commission declined to impose provisional anti-dumping measures on 18 December 2025, and no definitive rate had been published at the end of 2025. Import registration has run since 22 January 2026. The revenue at risk is capped by a line the company has never broken out: RMB986.1 million, 8.4% of FY2025 sales.
The FY2025 annual report describes the European proceedings as unresolved. The European Union opened an anti-dumping investigation into car and light-truck tyres of Chinese origin on 21 May 2025 and a countervailing investigation into the same product on 6 November 2025; from 22 January 2026 it required importers to register the goods so that duty could later be applied retroactively; the dumping investigation period was calendar 2024 and the injury period ran back to 1 January 2021. The directors record "a certain impact on the Group's Shandong company" and frame the case as an opportunity to accelerate the overseas layout [1].
A peer carries the same docket one step further. Jiangsu General Science records that on 18 December 2025 the Commission gave notice that, in view of the technical complexity of the case, it would not impose provisional anti-dumping measures, that the investigation continued, and that as at the end of 2025 no final determination had been made and no final rate published [2]. That is where the record in this run ends: no filing, peer filing or news item indexed here reports a definitive European rate for this company or any other. What follows sizes the exposure without one.
The absence of a rate does not make the exposure unbounded, because the scope of the proceeding is already fixed. It covers tyres originating in China, so it reaches the Shandong base and not the Thai one, and it attaches to origin rather than to ownership — it does not sort the Chinese producers this report compares against each other the way the firm-specific United States rates do. The offshore-capacity ledger in Competition is where those differences live.
The registration is also less than it looks. Article 10(4) of the basic anti-dumping regulation conditions retroactive collection on provisional measures having been imposed, and on 18 December 2025 the Commission declined to impose them. The registration that has run since 22 January 2026 — the fact the FY2025 report flags as a risk — has no provisional measure behind it for a definitive duty to reach back to.
The size of the exposure
No filing in this corpus discloses revenue delivered to Europe. What it discloses is a six-way geographic split by delivery region, and Europe is inside the residual line.
Source: FY2025 Annual Report, Note 5 Segment Information, revenue by geographical location [3].
The company has used the same six-way split since it listed, and the 2018 prospectus defines the residual bucket: "Other countries" primarily comprises Oceanian and European countries [4]. Every euro of European revenue the group has ever booked sits in that line, alongside Australia and New Zealand. In FY2025 the line was RMB986.1 million [5], 8.4% of group revenue of RMB11,806.8 million.
That line has been the fastest-growing thing in the business. It was RMB280.0 million in FY2021 [6], RMB496.2 million in FY2022 [7], RMB714.2 million in FY2023 [8] and RMB915.6 million in FY2024 [9]. Over four years it compounded at 37.0% a year against 11.9% for the group, and its share of revenue rose from 3.7% to 8.4%.
Sources: revenue by geographical location in the FY2021 [10], FY2022 [11], FY2023 [12], FY2024 [13] and FY2025 [14] annual reports; shares computed against reported group revenue.
RMB986.1 million is a ceiling, and a generous one. Three filters cut it down before any duty is paid. The proceeding covers only tyres of Chinese origin, so anything made at the Thai base is out — and the overseas segment, whose only plant is in Thailand, booked RMB4,527.1 million of the FY2025 total against RMB7,279.7 million domestic [15]. It covers only tyres with a load index not exceeding 121, which is the semi-steel range plus light-truck sizes, and semi-steel radials were RMB4,936.1 million of group revenue against RMB6,664.2 million of all-steel [16]. And the bucket itself contains Oceania as well as Europe.
Applying those filters gives a range rather than a number, because the company publishes neither the European share of the bucket nor a base-by-destination cut.
Sources: derived from the FY2025 revenue by geographical location [17], segment revenue by operating location [18], revenue by product [19] and profit for the year of RMB1,087.6 million [20]; no duty rate is on this run's record, so the duty columns are stated per 10 percentage points of rate.
The last row is the mix-neutral benchmark: if European sales carried the group's own product mix (41.8% semi-steel) and the group's own base mix (61.7% Shandong), RMB254.2 million of the bucket would be in scope. The exposed figure is likely higher than that on the product filter — Chinese exports to Europe skew heavily to passenger tyres, and the group's own European truck-tyre range only launched in June 2026 — and lower than the ceiling on the origin filter. Roughly RMB250 million to RMB630 million of exposed revenue is what the disclosure supports; each 10 percentage points of definitive duty on that range is RMB25 million to RMB63 million of gross duty, 2.3% to 5.8% of FY2025 profit for the year.
Two qualifications keep that from being read as a profit hit. The duty is levied on the importer against the customs value at the Union frontier, so the group loses only the share it cannot pass into price — and whatever rate is set applies to Chinese-origin producers as a class rather than to this company alone, which makes some pass-through more likely than in a firm-specific case. And the volume response matters as much as the rate: the annual report already notes that Chinese semi-steel export growth "slowed significantly in the fourth quarter due to the impact of the EU's anti-dumping investigation," before any duty existed [21].
The older truck-tyre measure
The passenger case is the second European measure on this group, not the first, and no annual report in this corpus mentions the first one.
Chinese-origin tyres for buses and lorries with a load index exceeding 121 — the heavy end of the all-steel range, which is 56.4% of group revenue in total — have carried European anti-dumping and countervailing duties since 2018. A peer's own filing records that on 15 January 2025 the Commission completed expiry reviews of both and continued them for a further five years, effective 17 January 2025, as company-differentiated fixed amounts per tyre: anti-dumping duty of €0 to €35.74 a tyre and countervailing duty of €3.75 to €57.28 a tyre across the companies covered [22]. That filing assigns no amount to Prinx Chengshan, and nothing in this corpus states where in those ranges its Shandong entity sits.
Those are fixed amounts per tyre, not percentages, so what they cost depends on the price of the tyre. Prinx Chengshan sold 8.398 million sets of all-steel radials in FY2025 [23] for RMB6,664.2 million [24], an average realised price of RMB793.5 a set. At the top of the peer-filed ranges the two duties together come to €93.02 a tyre, which at euro rates of RMB8.0 to RMB8.5 over the period is RMB744 to RMB791, or 94% to 100% of that average price. At the bottom of the ranges they come to €3.75, under 5% of it. Where in that span the Shandong entity falls is the difference between a cost and an exclusion, and the corpus does not say.
That range frames what the group has been building in Europe. It opened a European sales centre years ago [25], incorporated Prinx Chengshan Tire Europe GmbH in Darmstadt in March 2020 [26], completed European warehousing during 2025 [27], deepened its European original-equipment programmes [28], opened a European technical centre in November 2025 and launched the Xelera truck-tyre range at The Tire Cologne in June 2026 [29] [30]. A European truck-tyre push launched in the eighth year of a European duty on Chinese-origin truck tyres is more easily supplied from outside Shandong, and Thailand is the only base operating today. The filings do not say where the Xelera range is made, which is the disclosure that would convert this from an inference into a fact.
The two European dockets bear on different halves of the product line. All-steel radials are 56.4% of revenue and have carried European anti-dumping and countervailing duties since 2018; semi-steel radials are 41.8% and are the subject of the open passenger case. Both point the European build-out at offshore supply, on the same logic that built Thailand, and the base that would carry it, Malaysia, is not scheduled for trial production until the fourth quarter of 2026 [31], with capacity released across 2027 and 2028. The return arithmetic on that base is in Return on Capital; what this chapter adds is that its European demand case depends on the outcome of a proceeding the group does not control.
The subsidy case, still open
The subsidy half of the passenger case opened on 6 November 2025 [32] and, like the dumping half, has produced no determination on this record. Any countervailing duty would stack on top of whatever anti-dumping duty is set, and the truck-tyre precedent is not reassuring about the relative size: on that product the peer-filed countervailing range of €3.75 to €57.28 a tyre runs above the anti-dumping range of €0 to €35.74 [33].
What a subsidy investigation would look at is already disclosed. The group records a US$30 million facility from Bank of China (Thai) and a US$48 million facility from HSBC's Bangkok branch, both entered into on 15 March 2024 [34], and its register includes Sinotruk at 8.59% with a board seat, as recorded in People. Those are ordinary financing and register disclosures in a Hong Kong filing. Whether a European countervailing calculation reaches them, through which programmes and at what rate, is not answerable from this corpus, and no chapter of this report prices it.
The rest of the docket, dated
The European proceedings are the largest open items, but they land inside a calendar of measures and events that is unusually dense over the next six months. The dated items below are what the next twelve months of earnings run through.
Sources: FY2025 Annual Report on the European and South African cases [35], the Malaysia construction timetable [36], the giant off-road tire milestone [37] and the carbon border mechanism [38]; a peer filing on the January 2025 expiry reviews and the December 2025 provisional-measures decision [39] and the deforestation timetable [40]; the news record for the H1 2025 interim, chief-executive and US review dates [41] [42]; the US Supreme Court ruling is outside this corpus.
Three of those entries deserve a sentence each.
The FY2026 interim, due by 31 August 2026, is the first filing that will show whether the Thai margin recovered; the half-year split it runs against is set out in Business. No interim report for any year is indexed in this run, so that number will have to be read from the announcement itself.
The measures outside Europe and the United States are proliferating rather than resolving. A peer's FY2025 filing records a Eurasian Economic Union sunset review opened on 14 November 2025 on Chinese truck tyres, where existing rates of 14.79% to 35.35% may be continued, and a Colombian anti-dumping investigation opened on 21 October 2025 on the same product [43]. Neither names Prinx Chengshan, and neither is in its filings; both apply to Chinese-origin truck tyres, which is the group's largest product line from its largest base.
The green rules arrive on the same schedule as the trade rules. The group's own risk section flags the proposed extension of the European carbon border mechanism to tyres in 2026, requiring full life-cycle carbon disclosure, alongside China's new tyre energy-consumption standards effective May 2025 [44]; a peer dates the deforestation regulation's application to the end of 2026 [45]. These are compliance costs rather than duties, and no filing quantifies them.
Europe and Oceania revenue, FY2025 (RMB m)
Share of FY2025 group revenue
Exposed on group product and base mix (RMB m)
Gross duty per 10 points of rate on that (RMB m)
Sources: revenue by geographical location in the FY2025 Annual Report [46]; the exposed figure applies the group's own FY2025 product and base mix to the Other countries line, and no definitive European rate is on this run's record.
What would change the read
The evidence supports a narrow conclusion: the European passenger case is a cost in prospect on a small and fast-growing part of the business, the retroactive collection the FY2025 report flags has no provisional measure behind it, and the more consequential European fact is the older truck-tyre measure that the company's filings never mention. On the disclosure available, roughly RMB250 million to RMB630 million of revenue is exposed, so each 10 percentage points of duty costs RMB25 million to RMB63 million against a profit for the year of RMB1,087.6 million [47]. For comparison, restoring the Thai base to its FY2024 margin would be worth RMB302.9 million of gross profit, as set out in Thailand Margin and Tax.
The strongest fact against that read is that neither European half has reported on this record. The corpus bounds the exposed revenue but not the rate: the anti-dumping determination is not on it, a countervailing duty would stack on top of whatever that determination sets, and on the truck-tyre product the peer-filed countervailing range runs above the anti-dumping range. Nothing in the corpus caps either, and this chapter's sensitivity is stated per 10 points of rate for that reason.
Three disclosures would settle most of this, and the group makes none of them. A Europe line separated from Oceania in the geographic note would replace the whole sensitivity table above with a number. A base-by-destination cut would say how much of that Europe line is made in Shandong rather than Thailand. And naming the production base for the European truck-tyre range would show whether the Thai plant is already doing the work the Malaysian plant is being built to do. Until then the range stands, and the dated items that narrow it are the FY2026 interim, due by 31 August 2026, and the two European determinations themselves.
The numbers behind Prinx Chengshan Holdings Limited: as-reported financial statements and company metrics for FY2021–FY2025, traced to the source filings, opened with the share-price history those statements have to justify. Every linked figure opens the exact page of the filing it was printed on, with the statement row highlighted. Amounts in RMB thousands unless noted.
Reading notes: All figures are in RMB thousands, exactly as printed in the filings (the consolidated financial statements are presented in thousands of Renminbi). Per-share figures are in RMB. Every FY2021–FY2025 cell in the four core statements, in the segment and geography tables and in the KPI block is cited to the page of the annual report that printed it; FY2021–FY2025 each use their own annual report, except the Domestic/Overseas segment split for FY2021, which the FY2021 report did not disclose (it reported a single operating segment) and which is therefore cited to the comparative column of the FY2022 annual report. The unlabelled printed subtotals on the Consolidated Statement of Financial Position (non-current assets, current assets, non-current liabilities, current liabilities) are cited to the five-year Financial Highlights table on p.6 of the FY2025 annual report, where the same figures are printed with their labels. Long-Term Record: FY2021–FY2025 come from the five-year Financial Highlights tables of the FY2025 annual report (p.5 and p.6); FY2017–FY2020 from the same tables in the FY2021 annual report; FY2016 from Appendix I (Accountants Report) of the 2018 IPO prospectus. FY2018–FY2019 operating cash flow has no filing in the corpus and is taken from the standardized data feed without a page link.
Share Price — Available History Since August 2025
The stock closed at HK$6.82 on Aug 03, 2026 — down 10% over the window shown, trading between HK$6.69 and HK$8.33.
Source: market price feed, daily closes, Aug 2025–Aug 2026 — the feed marks this available history as partial. Price return only, excludes dividends.
FY2025 at a Glance
Revenue (RMB thousands)
Operating income (RMB thousands)
Net income (RMB thousands)
Diluted EPS
Source: FY2025 consolidated statements [1] [2] [3] [4]. Click any linked figure to open the filing page with the row highlighted.
Revenue by Product Type
| Revenue by Product Type | FY2021 | FY2022 | FY2023 | FY2024 | FY2025 |
|---|---|---|---|---|---|
| All steel radial tires | 4,888,933 | 5,503,324 | 6,062,183 | 6,271,265 | 6,664,224 |
| Semi-steel radial tires | 2,511,046 | 2,564,976 | 3,511,486 | 4,496,262 | 4,936,109 |
| Bias tires | 137,182 | 83,652 | 153,894 | 202,479 | 201,395 |
| Trade of raw material related to tire products | — | — | 221,420 | 3,879 | 5,073 |
| Total revenue | 7,537,161 | 8,151,952 | 9,948,983 | 10,973,885 | 11,806,801 |
| Total revenue growth, derived | — | +8.2% | +22.0% | +10.3% | +7.6% |
Source: Note 6 Revenue in each year's annual report; total agreed to the Consolidated Statement of Profit or Loss [5] [2] [6] [4]. Click any linked figure to open the filing page with the row highlighted.
Segment Revenue and Segment Results (Domestic / Overseas)
| Segment Revenue and Segment Results (Domestic / Overseas) | FY2021 | FY2022 | FY2023 | FY2024 | FY2025 |
|---|---|---|---|---|---|
| Segment revenue — Domestic | 5,726,276 | 5,106,363 | 6,832,783 | 6,843,211 | 7,279,661 |
| Segment revenue — Overseas | 1,810,885 | 3,045,589 | 3,116,200 | 4,130,674 | 4,527,140 |
| Total segment revenue | 7,537,161 | 8,151,952 | 9,948,983 | 10,973,885 | 11,806,801 |
| Segment results — Domestic | 775,061 | 563,365 | 1,285,962 | 1,151,803 | 1,149,437 |
| Segment results — Overseas | 264,087 | 606,425 | 835,746 | 1,177,862 | 988,350 |
| Total segment results | 1,039,148 | 1,169,790 | 2,121,708 | 2,329,665 | 2,137,787 |
Source: Note 5 Segment Information. FY2021 figures are the comparative column of the FY2022 annual report — the FY2021 report reported a single operating segment [7] [8] [9] [10]. Click any linked figure to open the filing page with the row highlighted.
Income Statement
| Income Statement | FY2021 | FY2022 | FY2023 | FY2024 | FY2025 | FY2026E | FY2027E |
|---|---|---|---|---|---|---|---|
| Revenue | 7,537,161 | 8,151,952 | 9,948,983 | 10,973,885 | 11,806,801 | 11 | 12 |
| Cost of sales | (6,498,013) | (6,982,162) | (7,827,275) | (8,644,220) | (9,669,014) | — | — |
| Gross profit | 1,039,148 | 1,169,790 | 2,121,708 | 2,329,665 | 2,137,787 | — | — |
| Selling and distribution expenses | (437,849) | (497,489) | (526,161) | (517,042) | (522,194) | — | — |
| Administrative expenses | (175,966) | (184,636) | (213,836) | (235,957) | (233,446) | — | — |
| Research and development expenses | (253,979) | (229,196) | (239,953) | (250,747) | (258,989) | — | — |
| Other gains — net | 40,594 | 136,708 | 13,541 | 41,022 | 19,718 | — | — |
| Operating profit | 271,038 | 426,313 | 1,202,556 | 1,413,253 | 1,194,415 | — | — |
| Finance costs — net | (4,836) | (71,499) | (72,499) | (28,840) | (243) | — | — |
| Profit before income tax | 265,902 | 354,739 | 1,130,545 | 1,384,497 | 1,194,387 | — | — |
| Income tax expense | 10,400 | 39,083 | (97,105) | (72,629) | (106,793) | — | — |
| Profit for the year | 276,302 | 393,822 | 1,033,440 | 1,311,868 | 1,087,594 | — | — |
| Profit attributable to shareholders of the Company | 276,304 | 393,783 | 1,033,391 | 1,311,837 | 1,087,559 | — | — |
| Basic earnings per share (RMB) | 0.43 | 0.62 | 1.62 | 2.06 | 1.71 | — | — |
| Diluted earnings per share (RMB) | 0.43 | 0.62 | 1.62 | 2.06 | 1.71 | 1.81 | 2.00 |
| Weighted average number of ordinary shares in issue (thousands) | 636,321 | 636,440 | 636,440 | 637,407 | 636,035 | — | — |
| Revenue growth, derived | — | +8.2% | +22.0% | +10.3% | +7.6% | -100.0% | +10.8% |
Source: Consolidated Statement of Profit or Loss; share counts from Note 13 Earnings Per Share [1] [2] [3] [4]. Click any linked figure to open the filing page with the row highlighted.
Columns marked E are consensus analyst estimates from analyst consensus, shown alongside reported results for direct comparison; they are not company guidance.
Estimate source: analyst consensus (claude_web), as of 2026-08-03. Forecasts carry no filing page links. Consensus revenue sits well below the as-reported line for the last actual year — analysts often model a narrower revenue basis (e.g. net of interest or pass-through costs), so compare trends, not levels.
Balance Sheet
Source: Consolidated Statement of Financial Position; the unlabelled printed subtotals are cited to the five-year Financial Highlights table of the FY2025 annual report [11] [12] [13] [14]. Click any linked figure to open the filing page with the row highlighted.
Cash Flow
| Cash Flow | FY2021 | FY2022 | FY2023 | FY2024 | FY2025 |
|---|---|---|---|---|---|
| Cash generated from operations | 473,316 | 888,024 | 1,116,015 | 1,434,881 | 1,276,868 |
| Net cash inflow from operating activities | 382,125 | 805,421 | 996,805 | 1,250,208 | 1,201,152 |
| Purchases of property, plant and equipment and land use rights | (1,376,578) | (578,291) | (431,521) | (582,427) | (577,295) |
| Purchase of intangible assets | (25,204) | (19,013) | (6,704) | (7,400) | (4,159) |
| Net cash outflow from investing activities | (1,341,972) | (681,674) | (306,311) | (515,276) | (540,162) |
| Proceeds from borrowings | 1,646,578 | 712,934 | 179,300 | 906,345 | 1,548,393 |
| Repayments of borrowings | (394,477) | (504,353) | (1,187,451) | (1,362,162) | (1,605,762) |
| Cash dividends paid | (104,900) | (106,102) | (111,510) | (254,695) | (285,013) |
| Net cash outflow from financing activities | 1,139,031 | 89,880 | (1,132,438) | (733,820) | (167,456) |
| Net increase in cash and cash equivalents | 179,184 | 213,627 | (441,944) | 1,112 | 493,534 |
| Cash and cash equivalents at the end of year | 728,813 | 982,037 | 547,920 | 554,112 | 1,034,913 |
| Free cash flow, derived | (994,453) | 227,130 | 565,284 | 667,781 | 623,857 |
Source: Consolidated Statement of Cash Flows [15] [16] [17] [18]. Click any linked figure to open the filing page with the row highlighted.
Revenue by Geographical Location
| Revenue by Geographical Location | FY2021 | FY2022 | FY2023 | FY2024 | FY2025 |
|---|---|---|---|---|---|
| Domestic | 3,201,826 | 2,698,755 | 3,600,063 | 3,437,060 | 3,997,163 |
| Americas | 2,240,164 | 3,019,405 | 2,904,109 | 3,717,325 | 3,901,915 |
| Asia (excluding domestic) | 573,157 | 671,197 | 934,330 | 1,175,291 | 1,126,640 |
| Africa | 702,147 | 655,958 | 926,242 | 825,079 | 1,007,259 |
| Middle East | 539,904 | 610,471 | 870,072 | 903,503 | 787,756 |
| Other countries | 279,963 | 496,166 | 714,167 | 915,627 | 986,068 |
| Total revenue | 7,537,161 | 8,151,952 | 9,948,983 | 10,973,885 | 11,806,801 |
Source: Note 5 Segment Information — revenue by region of delivery. FY2021–FY2024 reports label the domestic row Mainland China and the Asia row Asia (excluding Mainland China); FY2021–FY2022 label the Americas row America [19] [2] [20] [4]. Click any linked figure to open the filing page with the row highlighted.
Design Production Capacity by Base (sets per year)
| Design Production Capacity by Base (sets per year) | FY2021 | FY2022 | FY2023 | FY2024 | FY2025 |
|---|---|---|---|---|---|
| Tire Production Base in Shandong — All Steel Radial Tires | — | 7,400,000 | 7,400,000 | 7,400,000 | 7,400,000 |
| Tire Production Base in Shandong — Semi-Steel Radial Tires | — | 11,200,000 | 11,200,000 | 11,530,000 | 11,530,000 |
| Tire Production Base in Thailand — All Steel Radial Tires | — | 2,000,000 | 2,000,000 | 2,000,000 | 2,000,000 |
| Tire Production Base in Thailand — Semi-Steel Radial Tires | — | 8,000,000 | 8,000,000 | 10,000,000 | 10,000,000 |
Source: company filings [21] [22] [23] [24]. Click any linked figure to open the filing page with the row highlighted.
Capacity Utilisation Rate by Base
| Capacity Utilisation Rate by Base | FY2021 | FY2022 | FY2023 | FY2024 | FY2025 |
|---|---|---|---|---|---|
| Shandong — All Steel Radial Tires | — | 69.0% | 90.0% | 82.6% | 93.8% |
| Shandong — Semi-Steel Radial Tires | — | 85.8% | 96.8% | 97.8% | 92.6% |
| Thailand — All Steel Radial Tires | 86.7% | 94.4% | 81.0% | 87.1% | 80.6% |
| Thailand — Semi-Steel Radial Tires | 94.8% | 57.1% | 90.1% | 97.2% | 92.5% |
Source: company filings [21] [22] [23] [24]. Click any linked figure to open the filing page with the row highlighted.
Revenue by Sales Channel
| Revenue by Sales Channel | FY2021 | FY2022 | FY2023 | FY2024 | FY2025 |
|---|---|---|---|---|---|
| Distributors — Domestic | 2,043,029 | 1,879,559 | 2,381,065 | 2,325,553 | 2,078,900 |
| Distributors — International | 4,284,910 | 5,653,270 | 6,326,199 | 7,536,794 | 7,796,562 |
| Total distributor channel (incl. private label) | 6,327,939 | 7,532,829 | 8,707,264 | 9,862,347 | 9,875,462 |
| Direct sales to automobile manufacturers (OE) | 1,209,222 | 619,123 | 1,020,299 | 1,107,659 | 1,926,266 |
Source: company filings [25] [26] [27] [28]. Click any linked figure to open the filing page with the row highlighted.
Key Financial Indicators (as reported)
| Key Financial Indicators (as reported) | FY2021 | FY2022 | FY2023 | FY2024 | FY2025 |
|---|---|---|---|---|---|
| Gross profit margin | 13.8% | 14.3% | 21.3% | 21.2% | 18.1% |
| Net profit margin | 3.7% | 4.8% | 10.4% | 12.0% | 9.2% |
| Return on total assets | 3.3% | 4.1% | 10.0% | 12.1% | 9.6% |
| Return on equity | 7.2% | 9.4% | 20.9% | 21.9% | 15.8% |
| Asset to liability ratio | 56.9% | 55.4% | 48.8% | 40.6% | 38.8% |
| Gearing ratio (net debt / total capital) | 21.4% | 19.1% | 8.7% | 1.7% | (5.7%) |
| EBITDA | — | — | 1,710,000 | 1,990,000 | 1,768,000 |
Source: company filings [29] [30] [31] [13]. Click any linked figure to open the filing page with the row highlighted.
Product Development, Patents and People
| Product Development, Patents and People | FY2021 | FY2022 | FY2023 | FY2024 | FY2025 |
|---|---|---|---|---|---|
| New tire products developed and launched | 401 | 375 | 463 | 520 | 599 |
| Sales volume of new products (sets) | 8,588,000 | 6,762,000 | 8,236,000 | 11,094,000 | 9,282,000 |
| New products as share of total sales volume | 46.1% | 36.5% | 32.9% | 39.7% | 31.7% |
| Intellectual property rights granted (cumulative) | 273 | 330 | 382 | 444 | 520 |
| Employees at year end | 6,450 | 6,144 | 6,532 | 6,818 | 6,834 |
| Employee benefit expenses | 613,700 | 636,800 | 725,500 | 746,700 | 808,100 |
Source: company filings [32] [33] [34] [35]. Click any linked figure to open the filing page with the row highlighted.
Long-Term Record
| Fiscal year | Revenue | Gross profit | Profit for the year | Diluted earnings per share (RMB) | Net cash inflow from operating activities | Net assets |
|---|---|---|---|---|---|---|
| FY2016 | 3,821,728 | 827,799 | 291,206 | 0.67 | 692,902 | 1,496,637 |
| FY2017 | 4,840,396 | 768,597 | 173,572 | 0.40 | 180,074 | 1,601,249 |
| FY2018 | 5,206,087 | 1,003,053 | 478,600 | 0.90 | 817,787 | 3,045,957 |
| FY2019 | 5,588,988 | 1,075,274 | 479,717 | 0.76 | 649,691 | 3,414,318 |
| FY2020 | 6,283,130 | 1,401,363 | 604,748 | 0.95 | 649,687 | 3,780,203 |
| FY2021 | 7,537,161 | 1,039,148 | 276,302 | 0.43 | 382,125 | 3,920,132 |
| FY2022 | 8,151,952 | 1,169,790 | 393,822 | 0.62 | 805,421 | 4,451,869 |
| FY2023 | 9,948,983 | 2,121,708 | 1,033,440 | 1.62 | 996,805 | 5,433,743 |
| FY2024 | 10,973,885 | 2,329,665 | 1,311,868 | 2.06 | 1,250,208 | 6,543,463 |
| FY2025 | 11,806,801 | 2,137,787 | 1,087,594 | 1.71 | 1,201,152 | 7,189,409 |
Source: consolidated statements across filings; older years from the standardized feed [36] [37] [38] [15]. Click any linked figure to open the filing page with the row highlighted.
Operating KPIs
| KPI | FY2021 | FY2022 | FY2023 | FY2024 | FY2025 |
|---|---|---|---|---|---|
| Tire sales volume — total | 18,600,000 | 18,500,000 | 25,000,000 | 28,000,000 | 29,300,000 |
| Tire sales volume — All Steel Radial Tires | 6,600,000 | 6,700,000 | 8,100,000 | 8,000,000 | 8,400,000 |
| Tire sales volume — Semi-Steel Radial Tires | 11,600,000 | 11,500,000 | 16,400,000 | 19,500,000 | 20,400,000 |
| Tire sales volume — Bias Tires | 470,000 | 270,000 | 480,000 | 500,000 | 500,000 |
Source: company-reported operating metrics [31] [39] [40] [41]. Click any linked figure to open the filing page with the row highlighted.
Analyst Consensus
Mean target
Street ratings: NO LIVE SELL-SIDE CONSENSUS. Prinx Chengshan (1809.HK) has no usable multi-broker consensus at any reputable aggregator: Simply Wall St reports 0 analyst price targets and states it lacks sufficient coverage to forecast; MarketScreener shows no forward-estimates table; stockanalysis.com returns n/a for price target, rating, forward EPS and forward P/E; TipRanks shows zero traditional analyst ratings in the past 3 months (its 'HK$7.60 avg / 6 Buy' figure is from AI analysts — Anthropic, OpenAI, Google, DeepSeek, xAI, Perplexity — NOT sell-side, and was excluded). Investing.com, FT and WSJ paywall/CAPTCHA the data. Claims circulating of 'HK$11.32 target from 80 analysts' and 'Strong sell from 70 analysts' both originate from bitget.com AI-generated pages, are mutually contradictory, and were discarded. The price_target_mean of HK$8.61 is therefore NOT a mean — it is the single most recent genuine sell-side target found (GPF Financial / 环球富盛理财, 11 Jul 2025, rating 收集/Accumulate), and it is ~13 months old, i.e. outside a standard 12-month consensus window. On-record sell-side ratings, all Buy-equivalent but all stale: Guosen Securities Buy HK$12.25 (2025-03-31); Southwest Securities Buy, no target disclosed (2025-03-28); Huatong Securities Buy HK$9.43 (2024-11-21); Tianfeng Securities Overweight HK$9.35 (initiation, but dated 2019 — excluded as obsolete). Simple mean of the two most recent targets carrying a number (GPF HK$8.61, Guosen HK$12.25) would be HK$10.43. Directional skew is Buy/Accumulate with zero Hold or Sell ratings on record, but the count is 3-4 small Chinese/HK brokers and none has published inside the last 12 months. Shares last traded at HK$6.82 (52-week range HK$6.40-8.36, -9.9% over one year).
Estimate source: analyst consensus (claude_web), as of 2026-08-03. Forecasts carry no filing page links. Consensus revenue sits well below the as-reported line for the last actual year — analysts often model a narrower revenue basis (e.g. net of interest or pass-through costs), so compare trends, not levels.
Traceability
493 of 495 figures on this page (100%) link to the filing page where they are printed — click a linked figure to open the source PDF at that page with the row highlighted. Unlinked figures come from standardized data feeds or pre-filing years.
All figures are in RMB thousands, exactly as printed in the filings (the consolidated financial statements are presented in thousands of Renminbi). Per-share figures are in RMB.
Every FY2021–FY2025 cell in the four core statements, in the segment and geography tables and in the KPI block is cited to the page of the annual report that printed it; FY2021–FY2025 each use their own annual report, except the Domestic/Overseas segment split for FY2021, which the FY2021 report did not disclose (it reported a single operating segment) and which is therefore cited to the comparative column of the FY2022 annual report.
The unlabelled printed subtotals on the Consolidated Statement of Financial Position (non-current assets, current assets, non-current liabilities, current liabilities) are cited to the five-year Financial Highlights table on p.6 of the FY2025 annual report, where the same figures are printed with their labels.
Long-Term Record: FY2021–FY2025 come from the five-year Financial Highlights tables of the FY2025 annual report (p.5 and p.6); FY2017–FY2020 from the same tables in the FY2021 annual report; FY2016 from Appendix I (Accountants Report) of the 2018 IPO prospectus. FY2018–FY2019 operating cash flow has no filing in the corpus and is taken from the standardized data feed without a page link.
Line-item labels vary slightly across vintages and the tab uses the FY2025 wording: research and development expenses (FY2021–FY2024: costs), net cash inflow/outflow from operating/investing/financing activities (FY2021–FY2023: net cash generated from / used in), and purchases of property, plant and equipment and land use rights (FY2021–FY2024: purchases of property, plant and equipment). Each citation quote carries the label as printed in that year's filing.
The filings' own caption on the net-change-in-cash line is inconsistent: the FY2022 and FY2024 statements print Net decrease in cash and cash equivalents above a positive figure (213,627 and 1,112 respectively). The printed captions and figures are reproduced unchanged.
Revenue by geographical location: the FY2025 report labels the domestic row Domestic and the Asia row Asia (excluding domestic); the FY2021–FY2024 reports label them Mainland China and Asia (excluding Mainland China), and the FY2021–FY2022 reports label the Americas row America. The geography split is by region of delivery and is not the same cut as the Domestic/Overseas operating segments, which are defined by production location.
Trade of raw material related to tire products was first disclosed as a separate revenue line in the FY2023 annual report; the FY2021 and FY2022 revenue notes carry no such line, so those cells are null rather than zero.
Cross-check against data/financials: every revenue, operating profit, pre-tax profit, net profit, balance-sheet aggregate, cash-flow subtotal, EPS and product-revenue figure in the feed agreed with the filings to the rounding of RMB thousands. The only differences found are the share-count definition entries in discrepancies. The feed's capex field (e.g. FY2025: 581,454) bundles purchases of property, plant and equipment and land use rights (577,295) with purchases of intangible assets (4,159); the tab shows the two printed lines separately.
No interim or quarterly financial statements are present in the indexed corpus (the single quarterly_reports document is the FY2021 full-year results announcement), so no quarterly block is emitted.
2 figure(s) differed between the data feed and the filing; the filing value is shown (see the run's metrics/metrics_tab.json for the audit trail).
Prinx Chengshan Holdings Limited's management explains the business in its own materials. The slides below do the most of that work, pulled from the documents preserved in Sources. Each source link opens the complete presentation at that slide in a new tab.
Annual Report 2025 — overview and business review pages — FY2025
No investor deck exists; the designed front section of the FY2025 annual report is management's own overview of the business. · Open the full document →
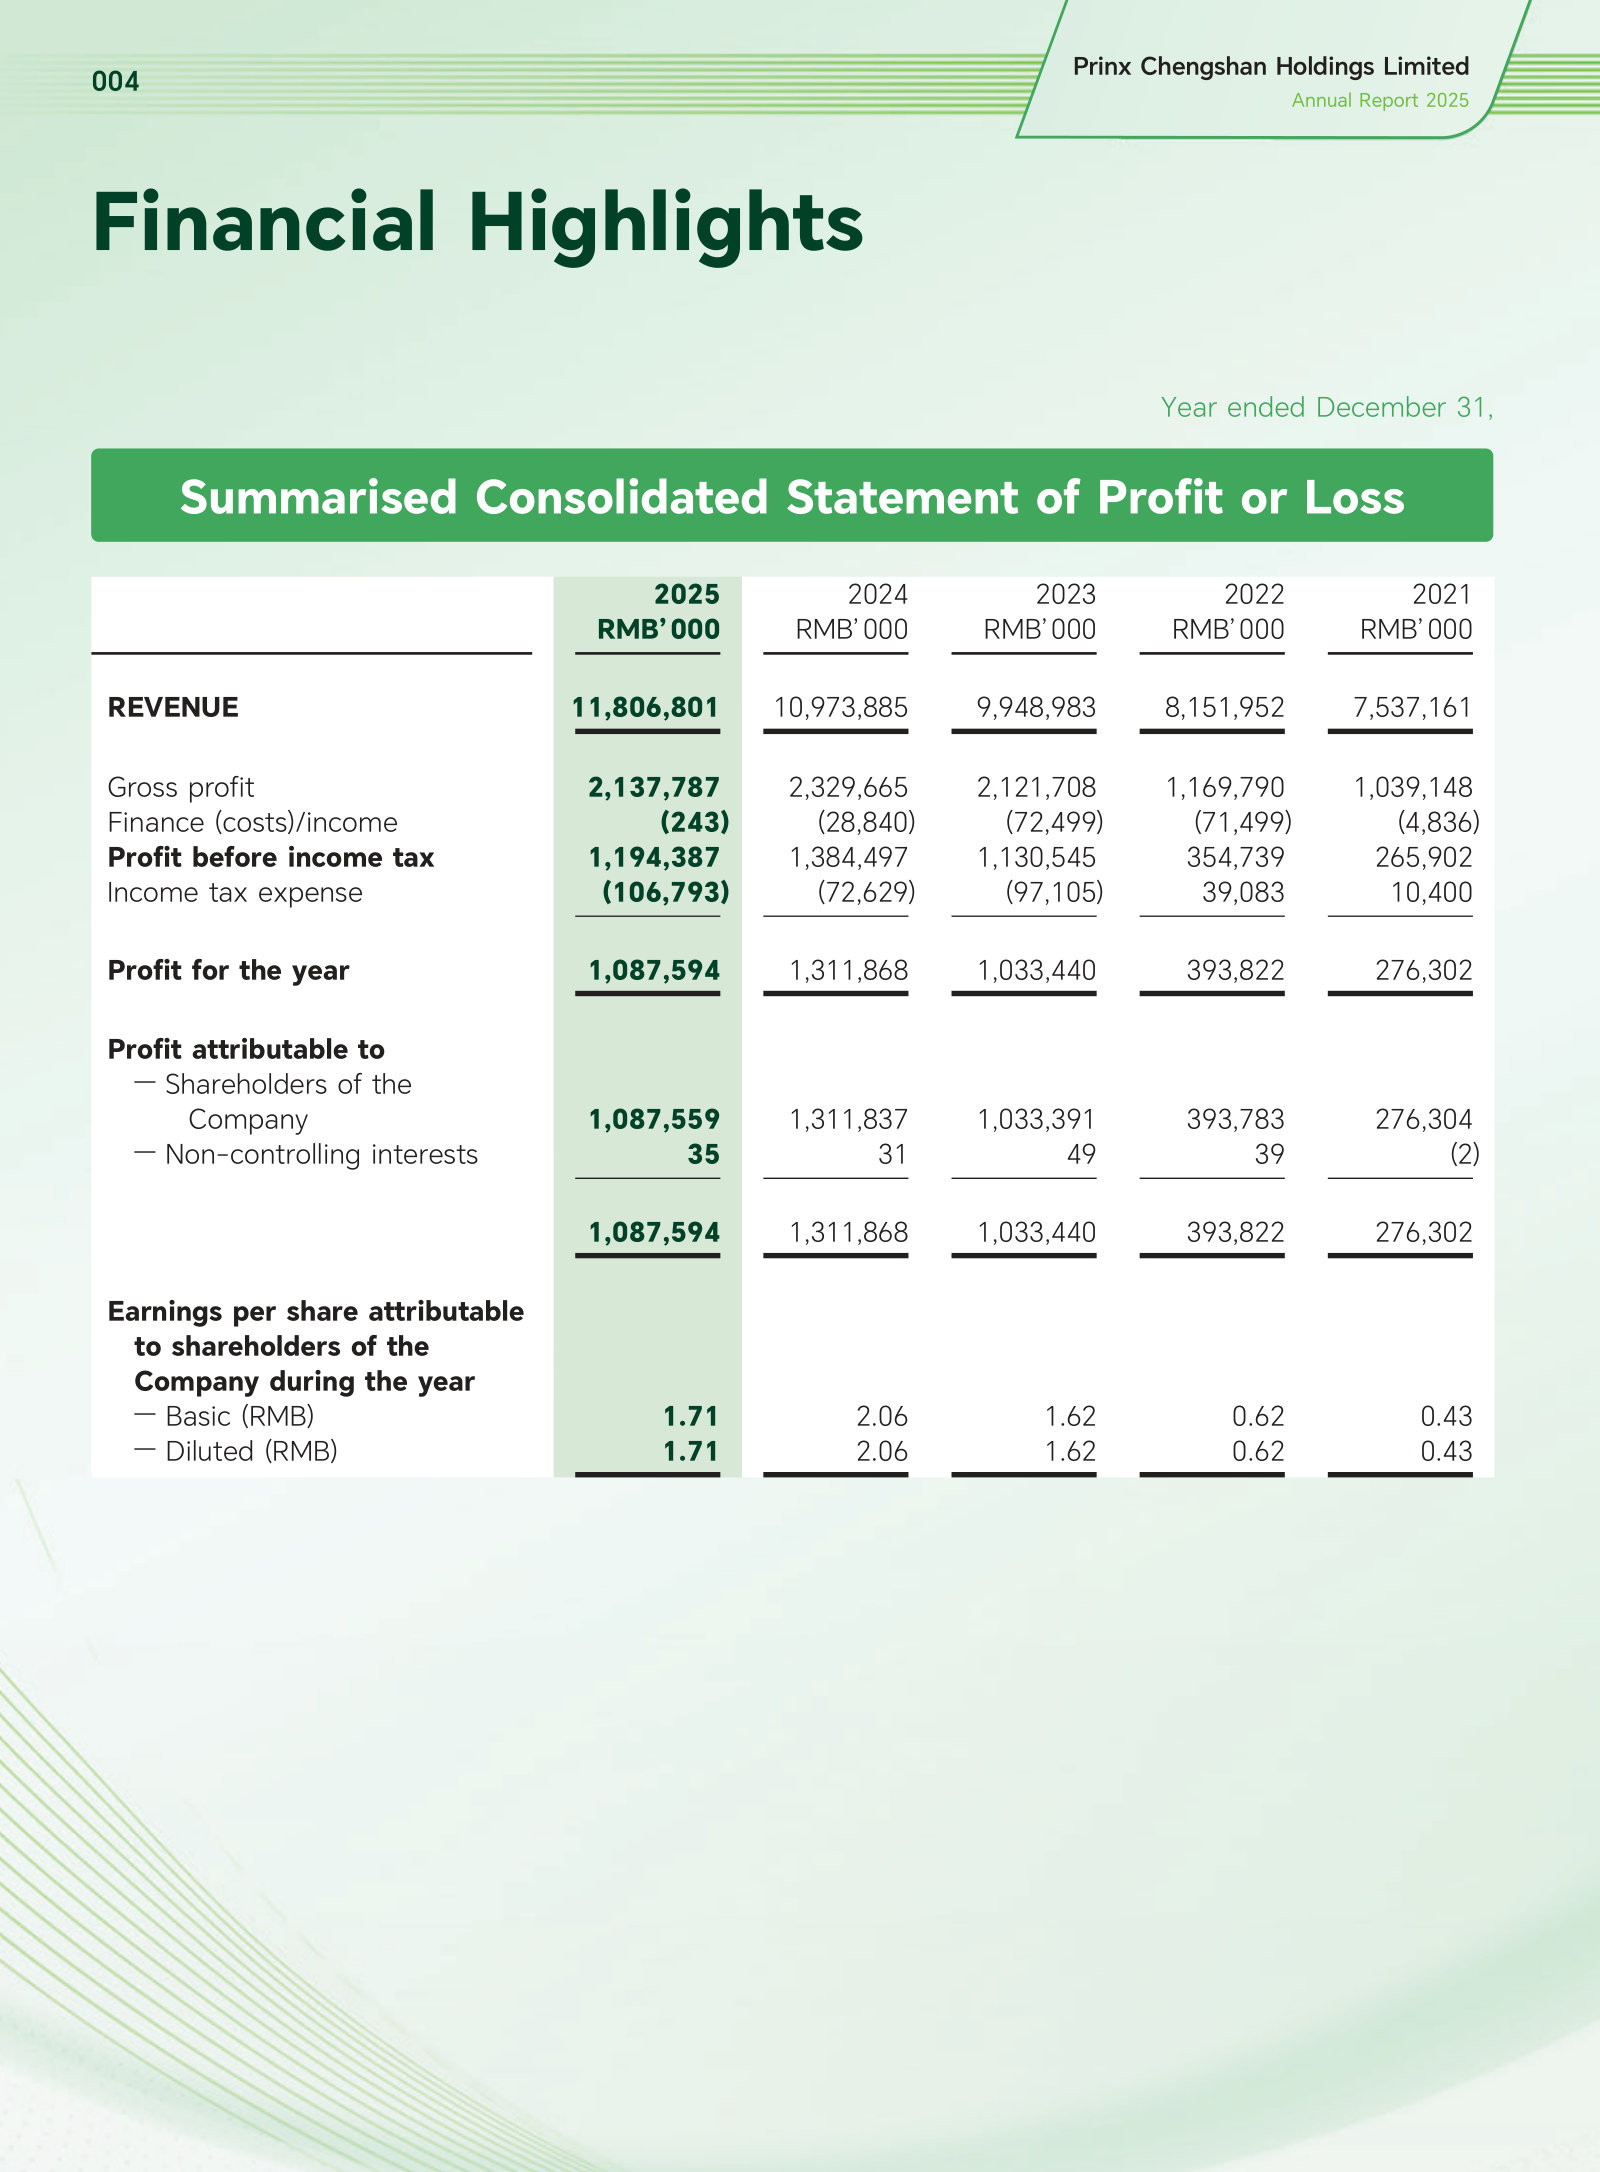
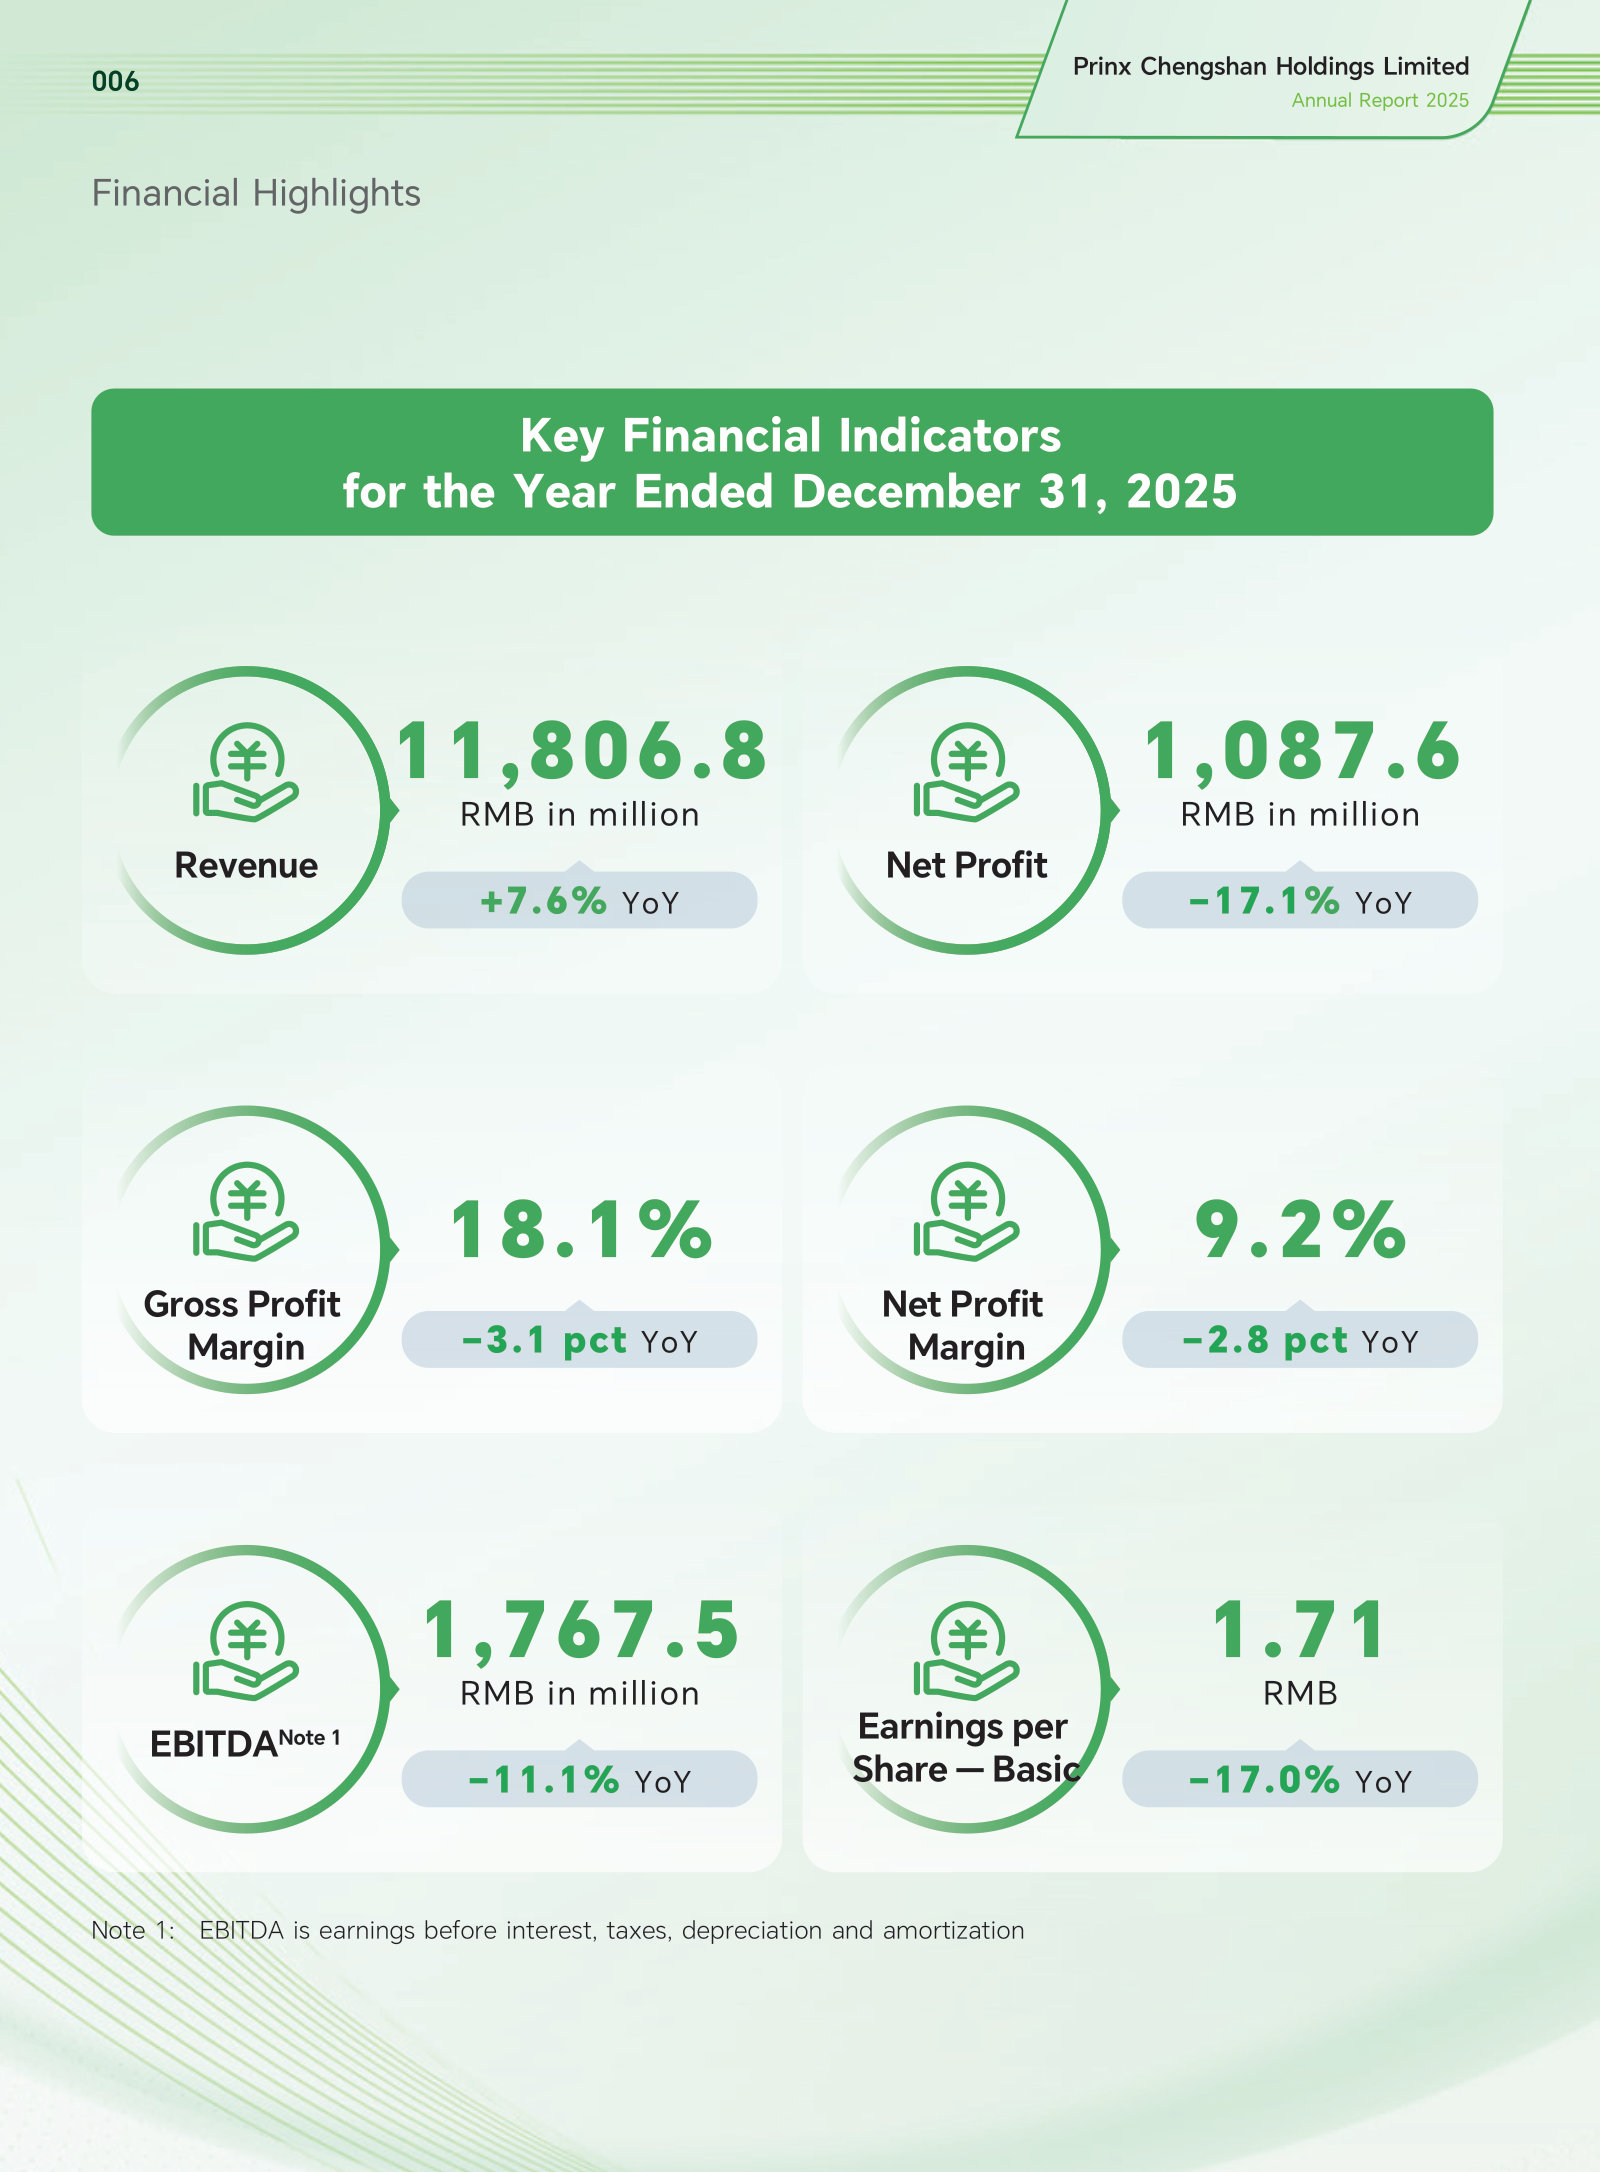
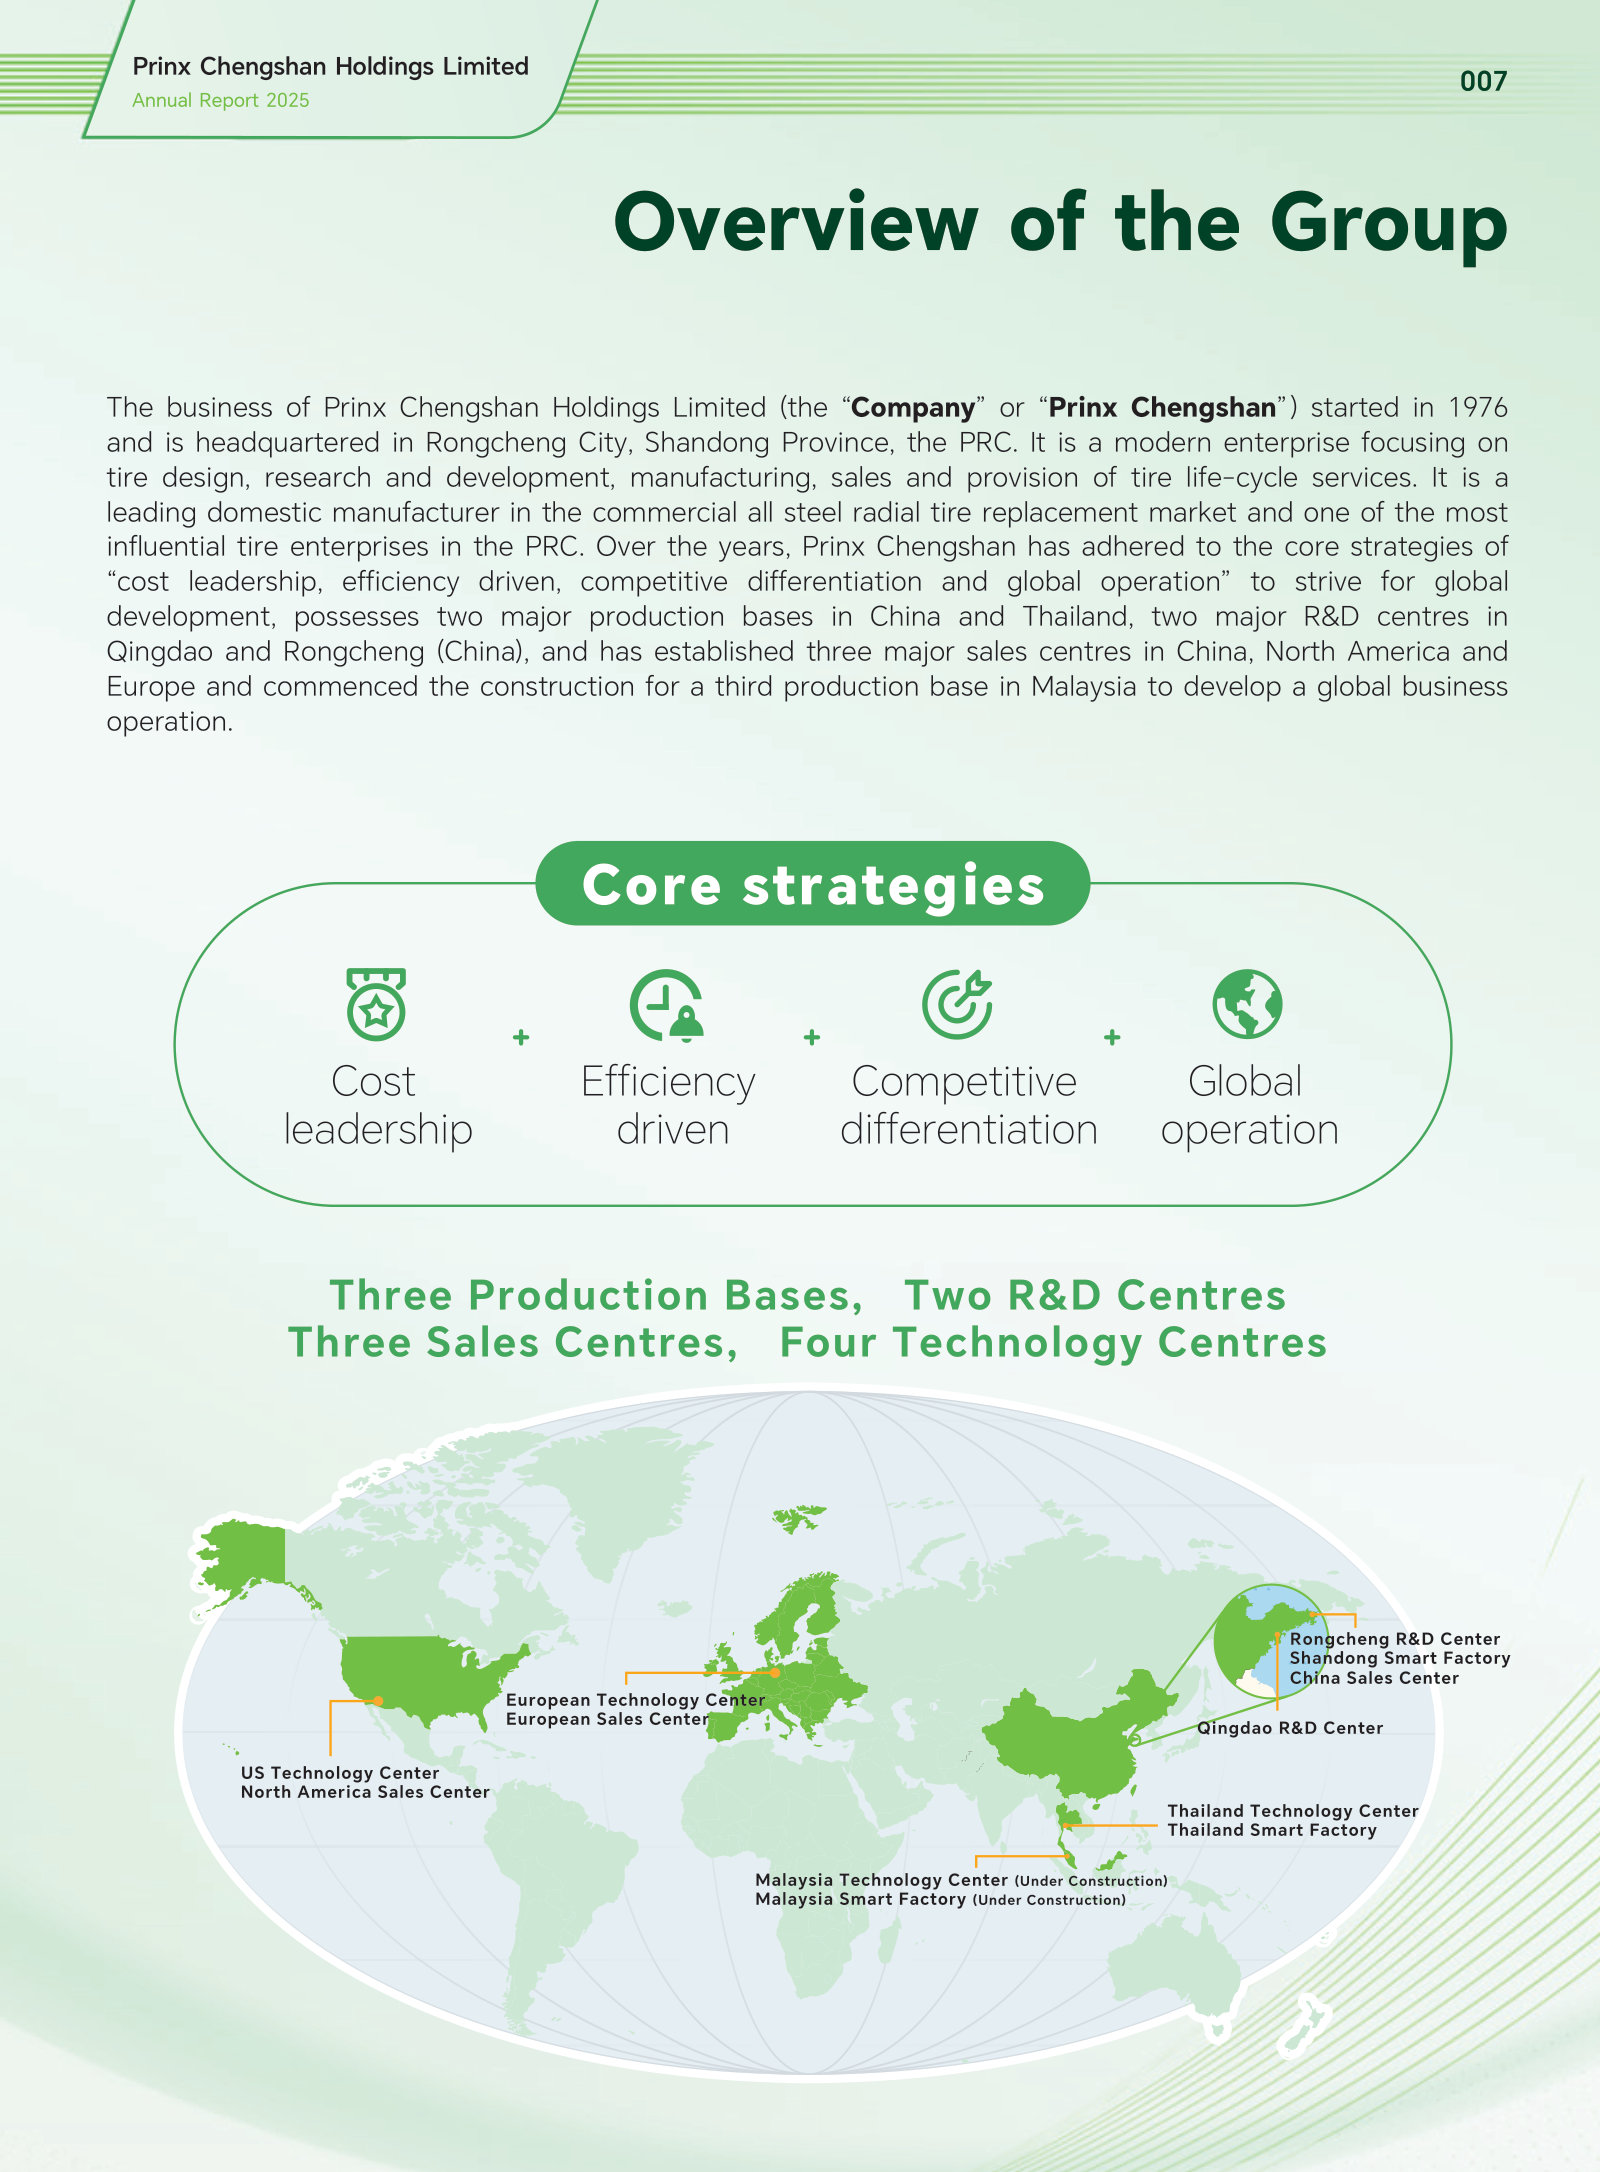
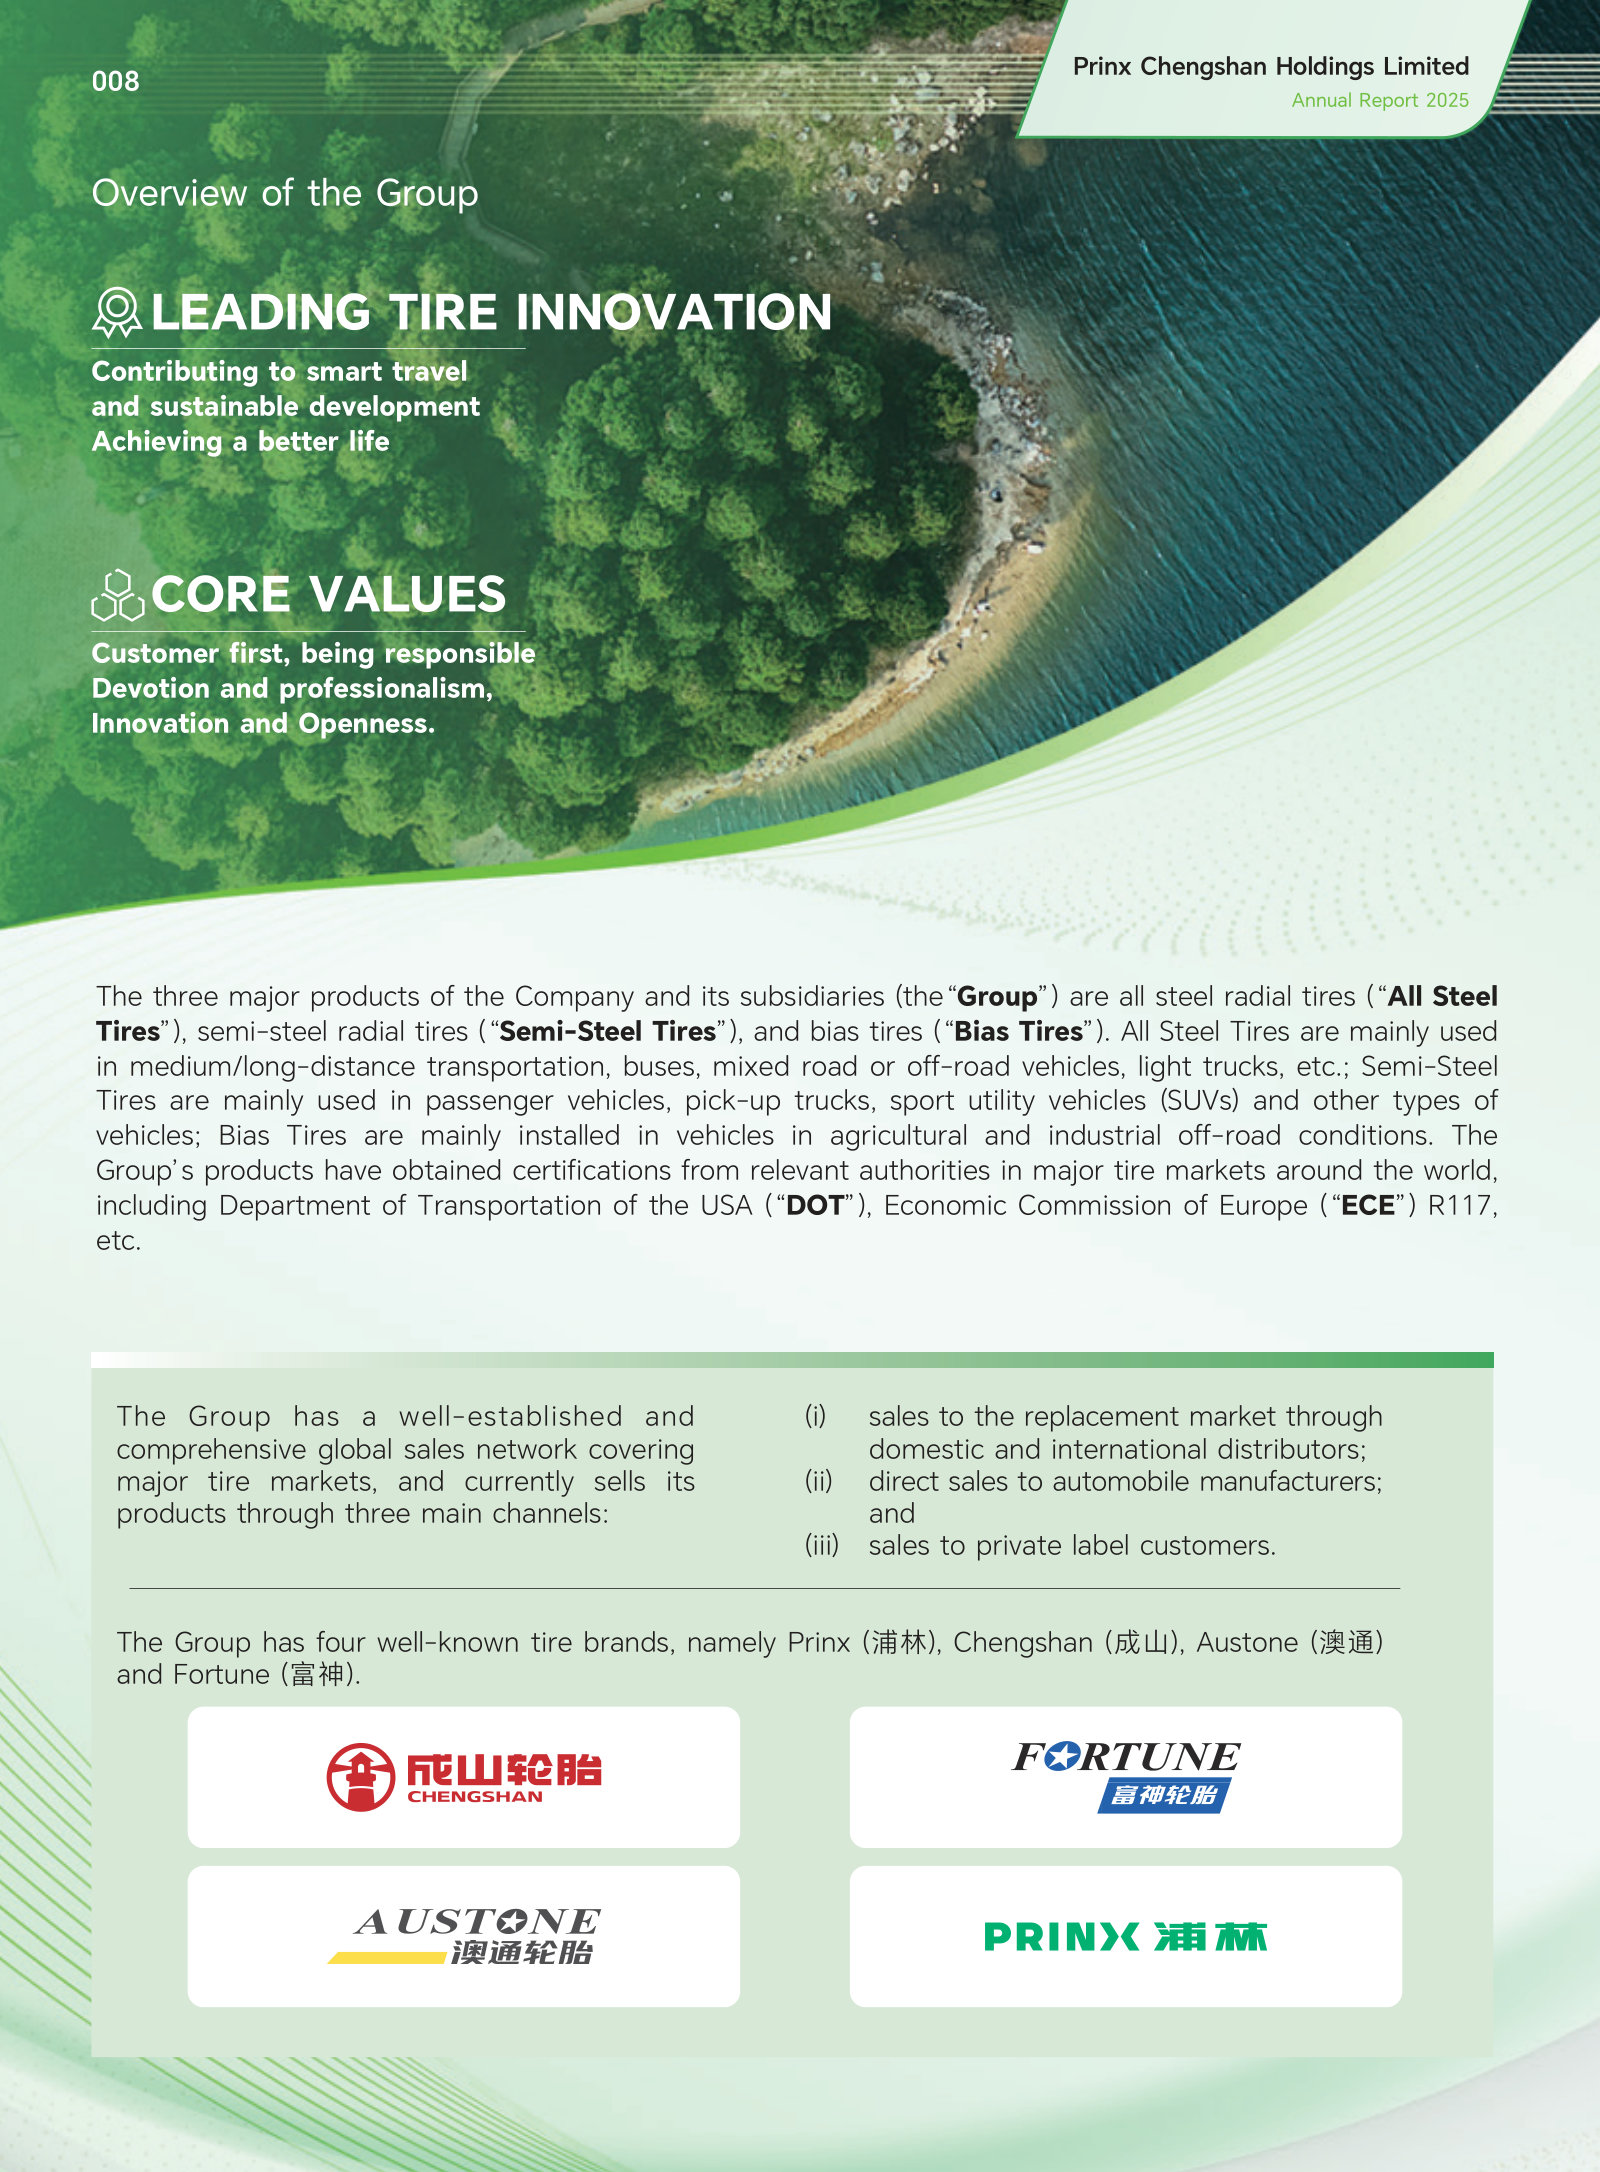
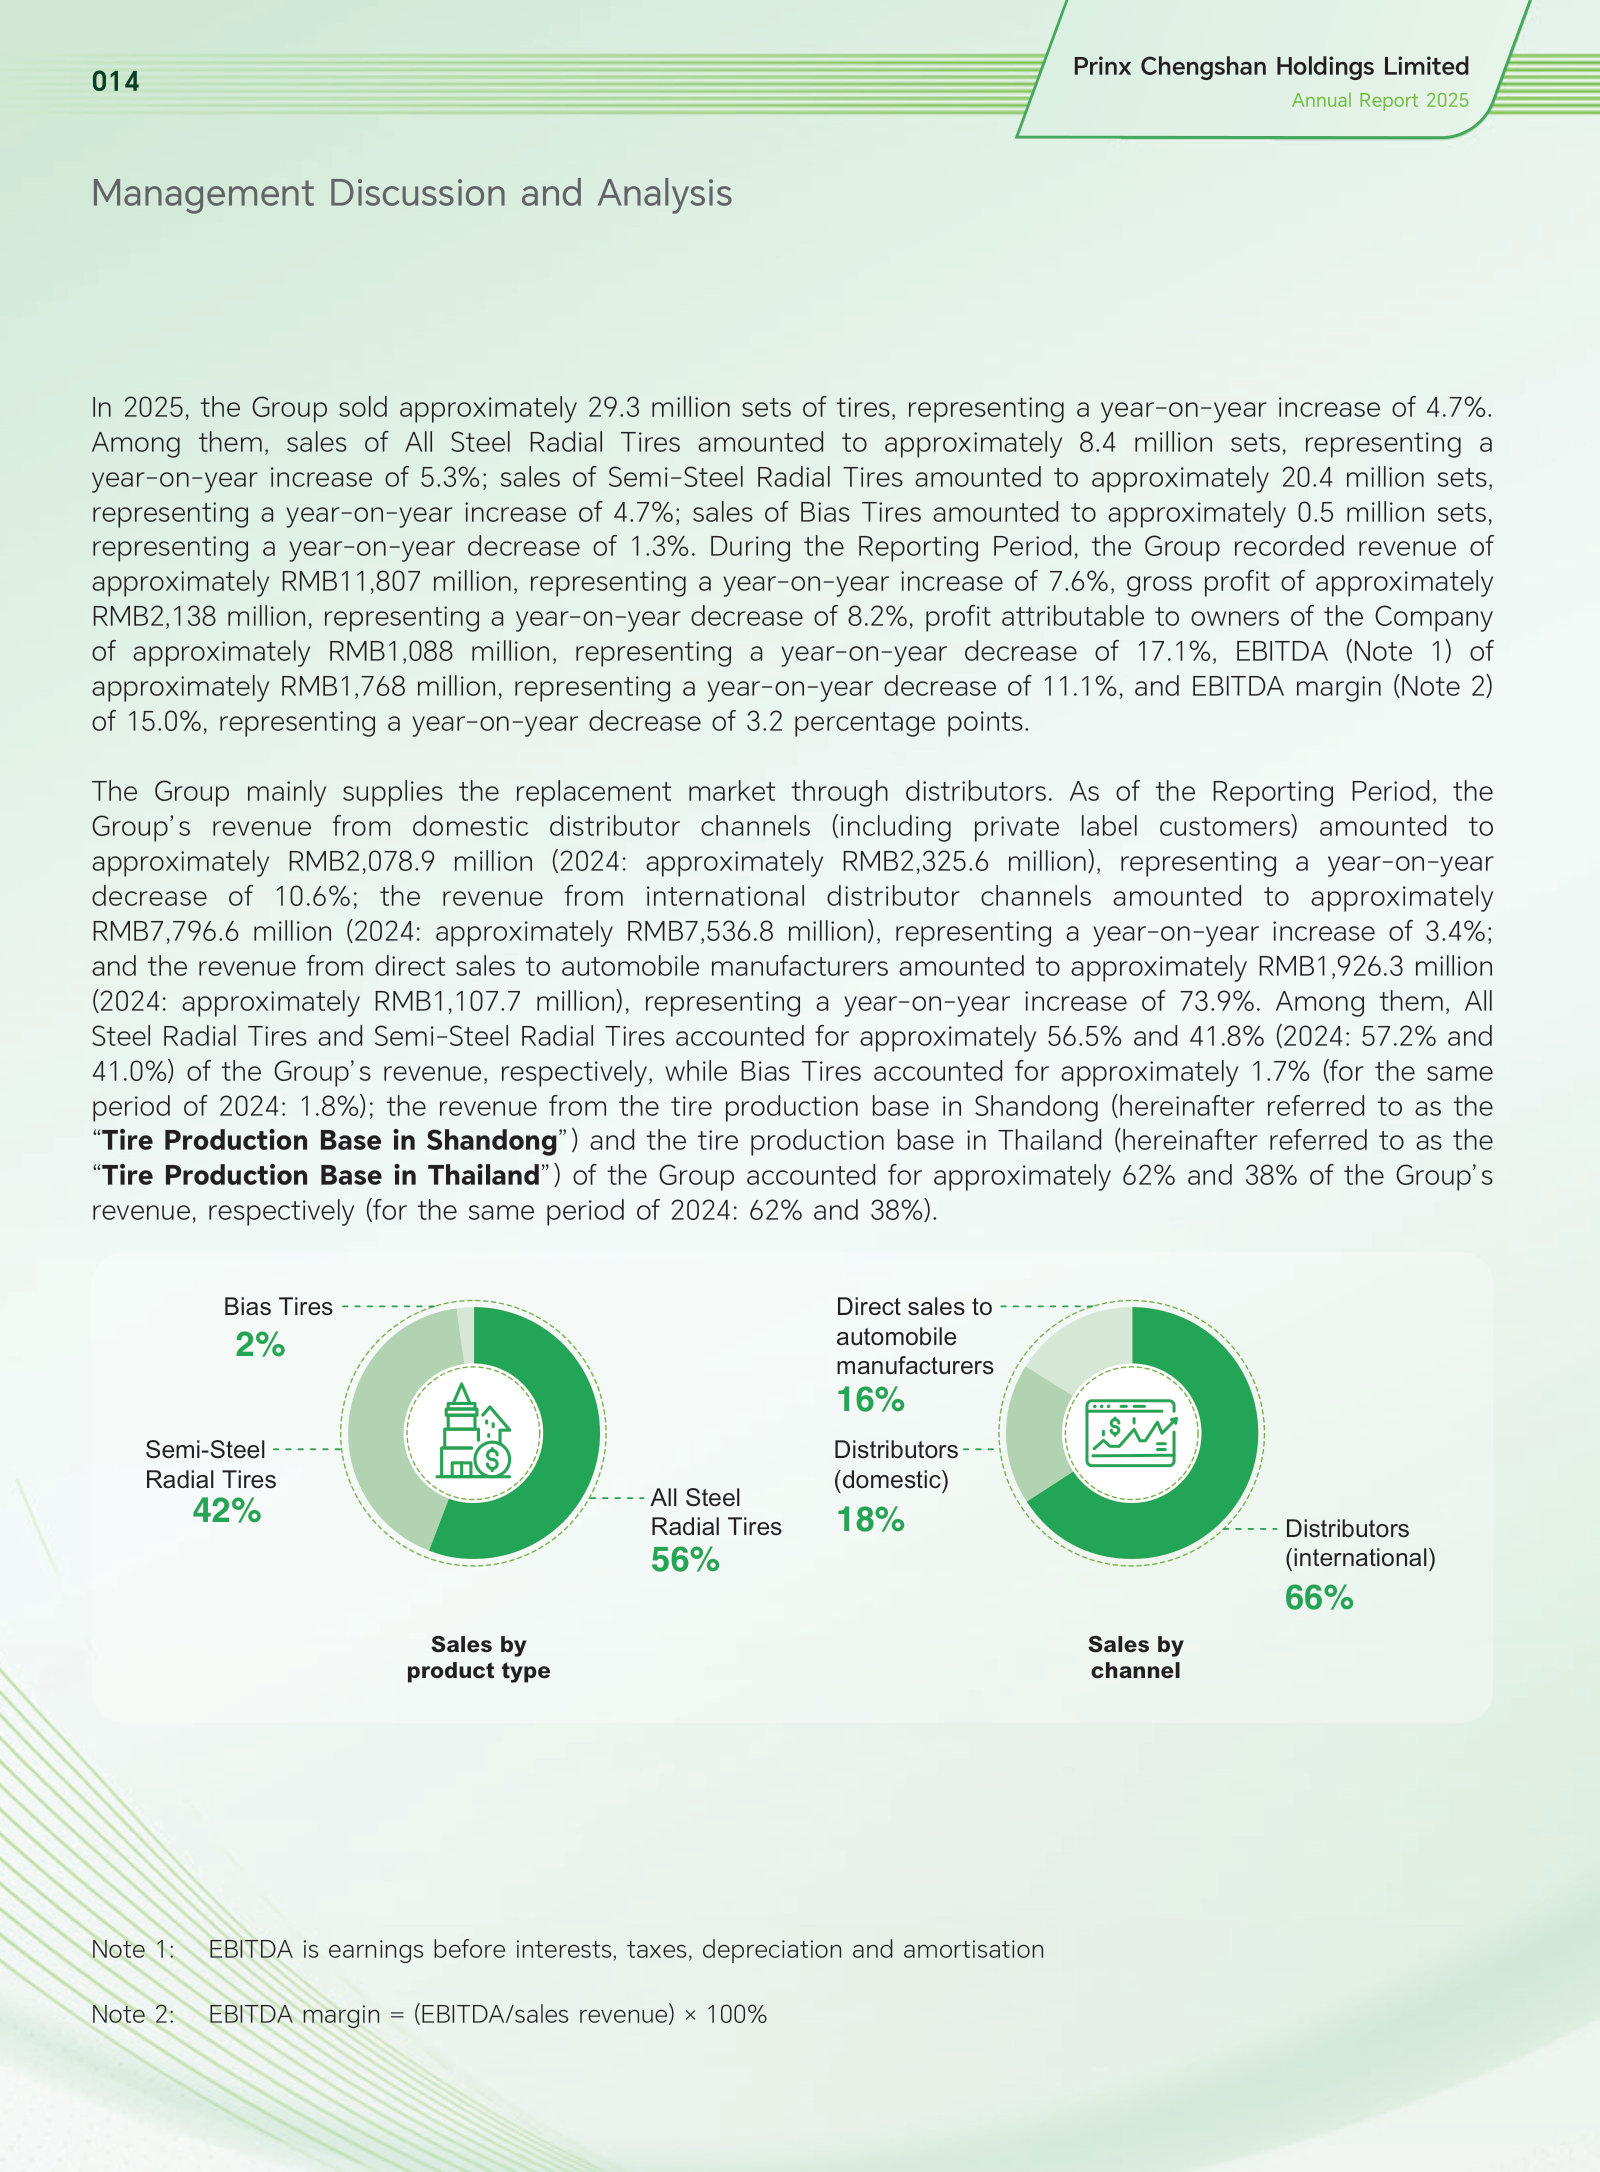
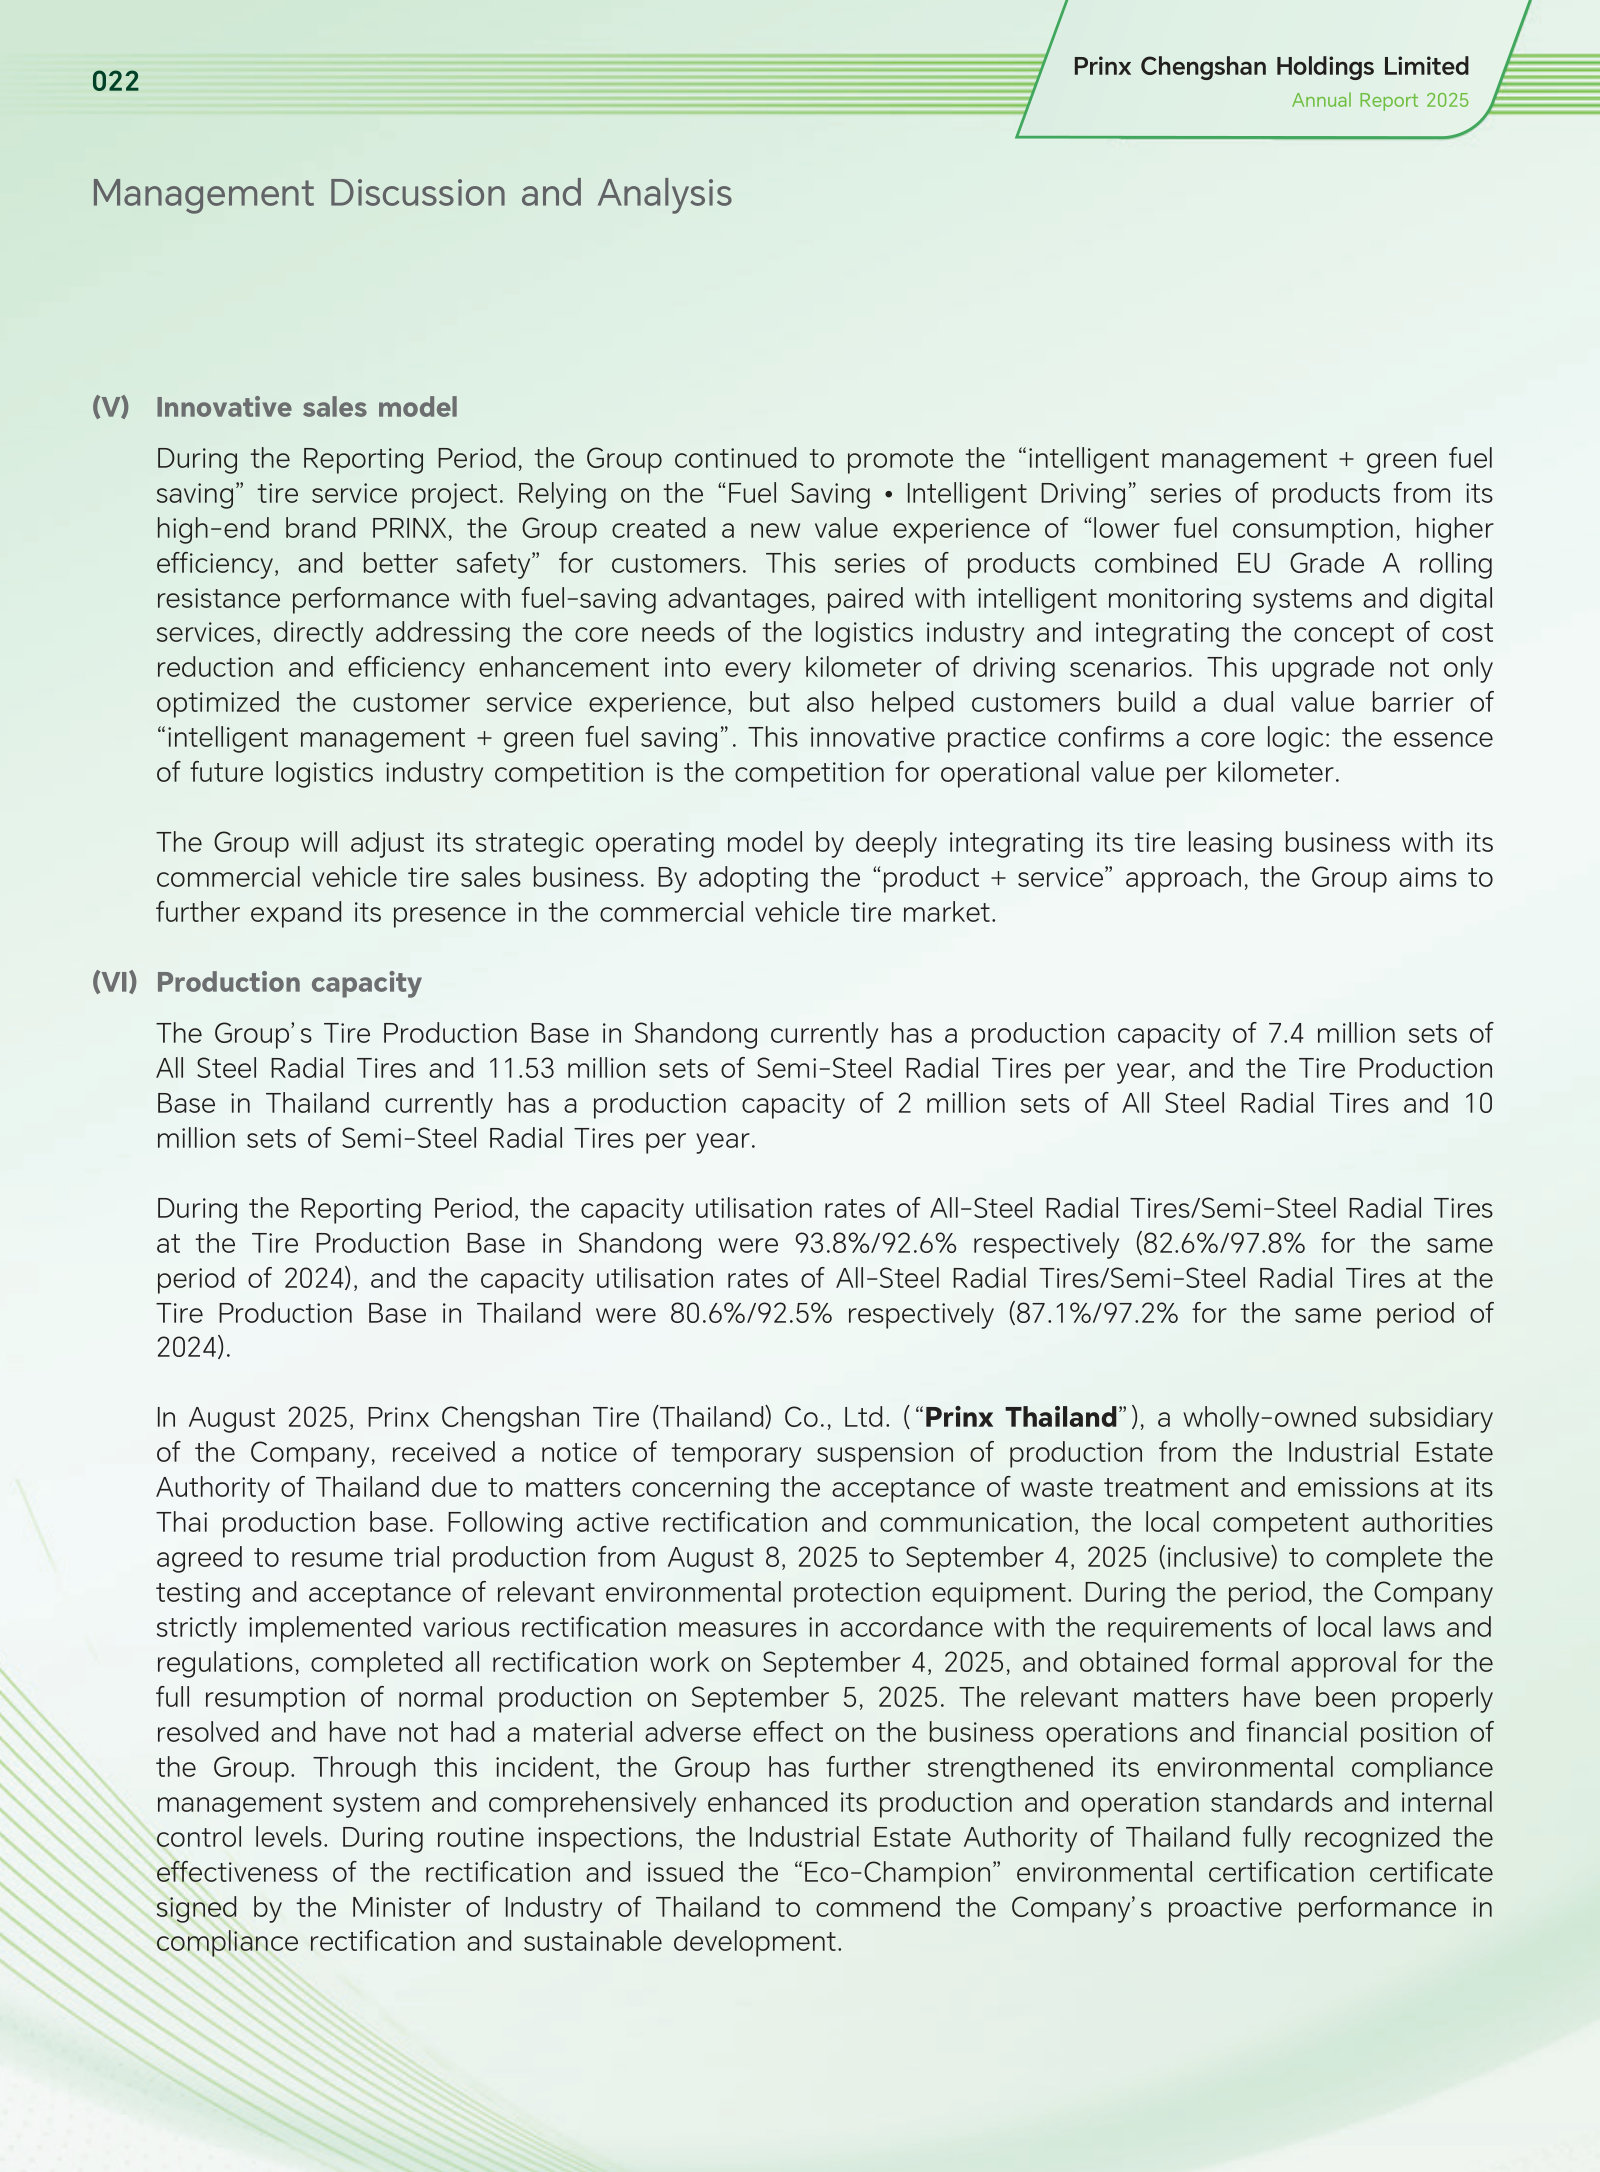
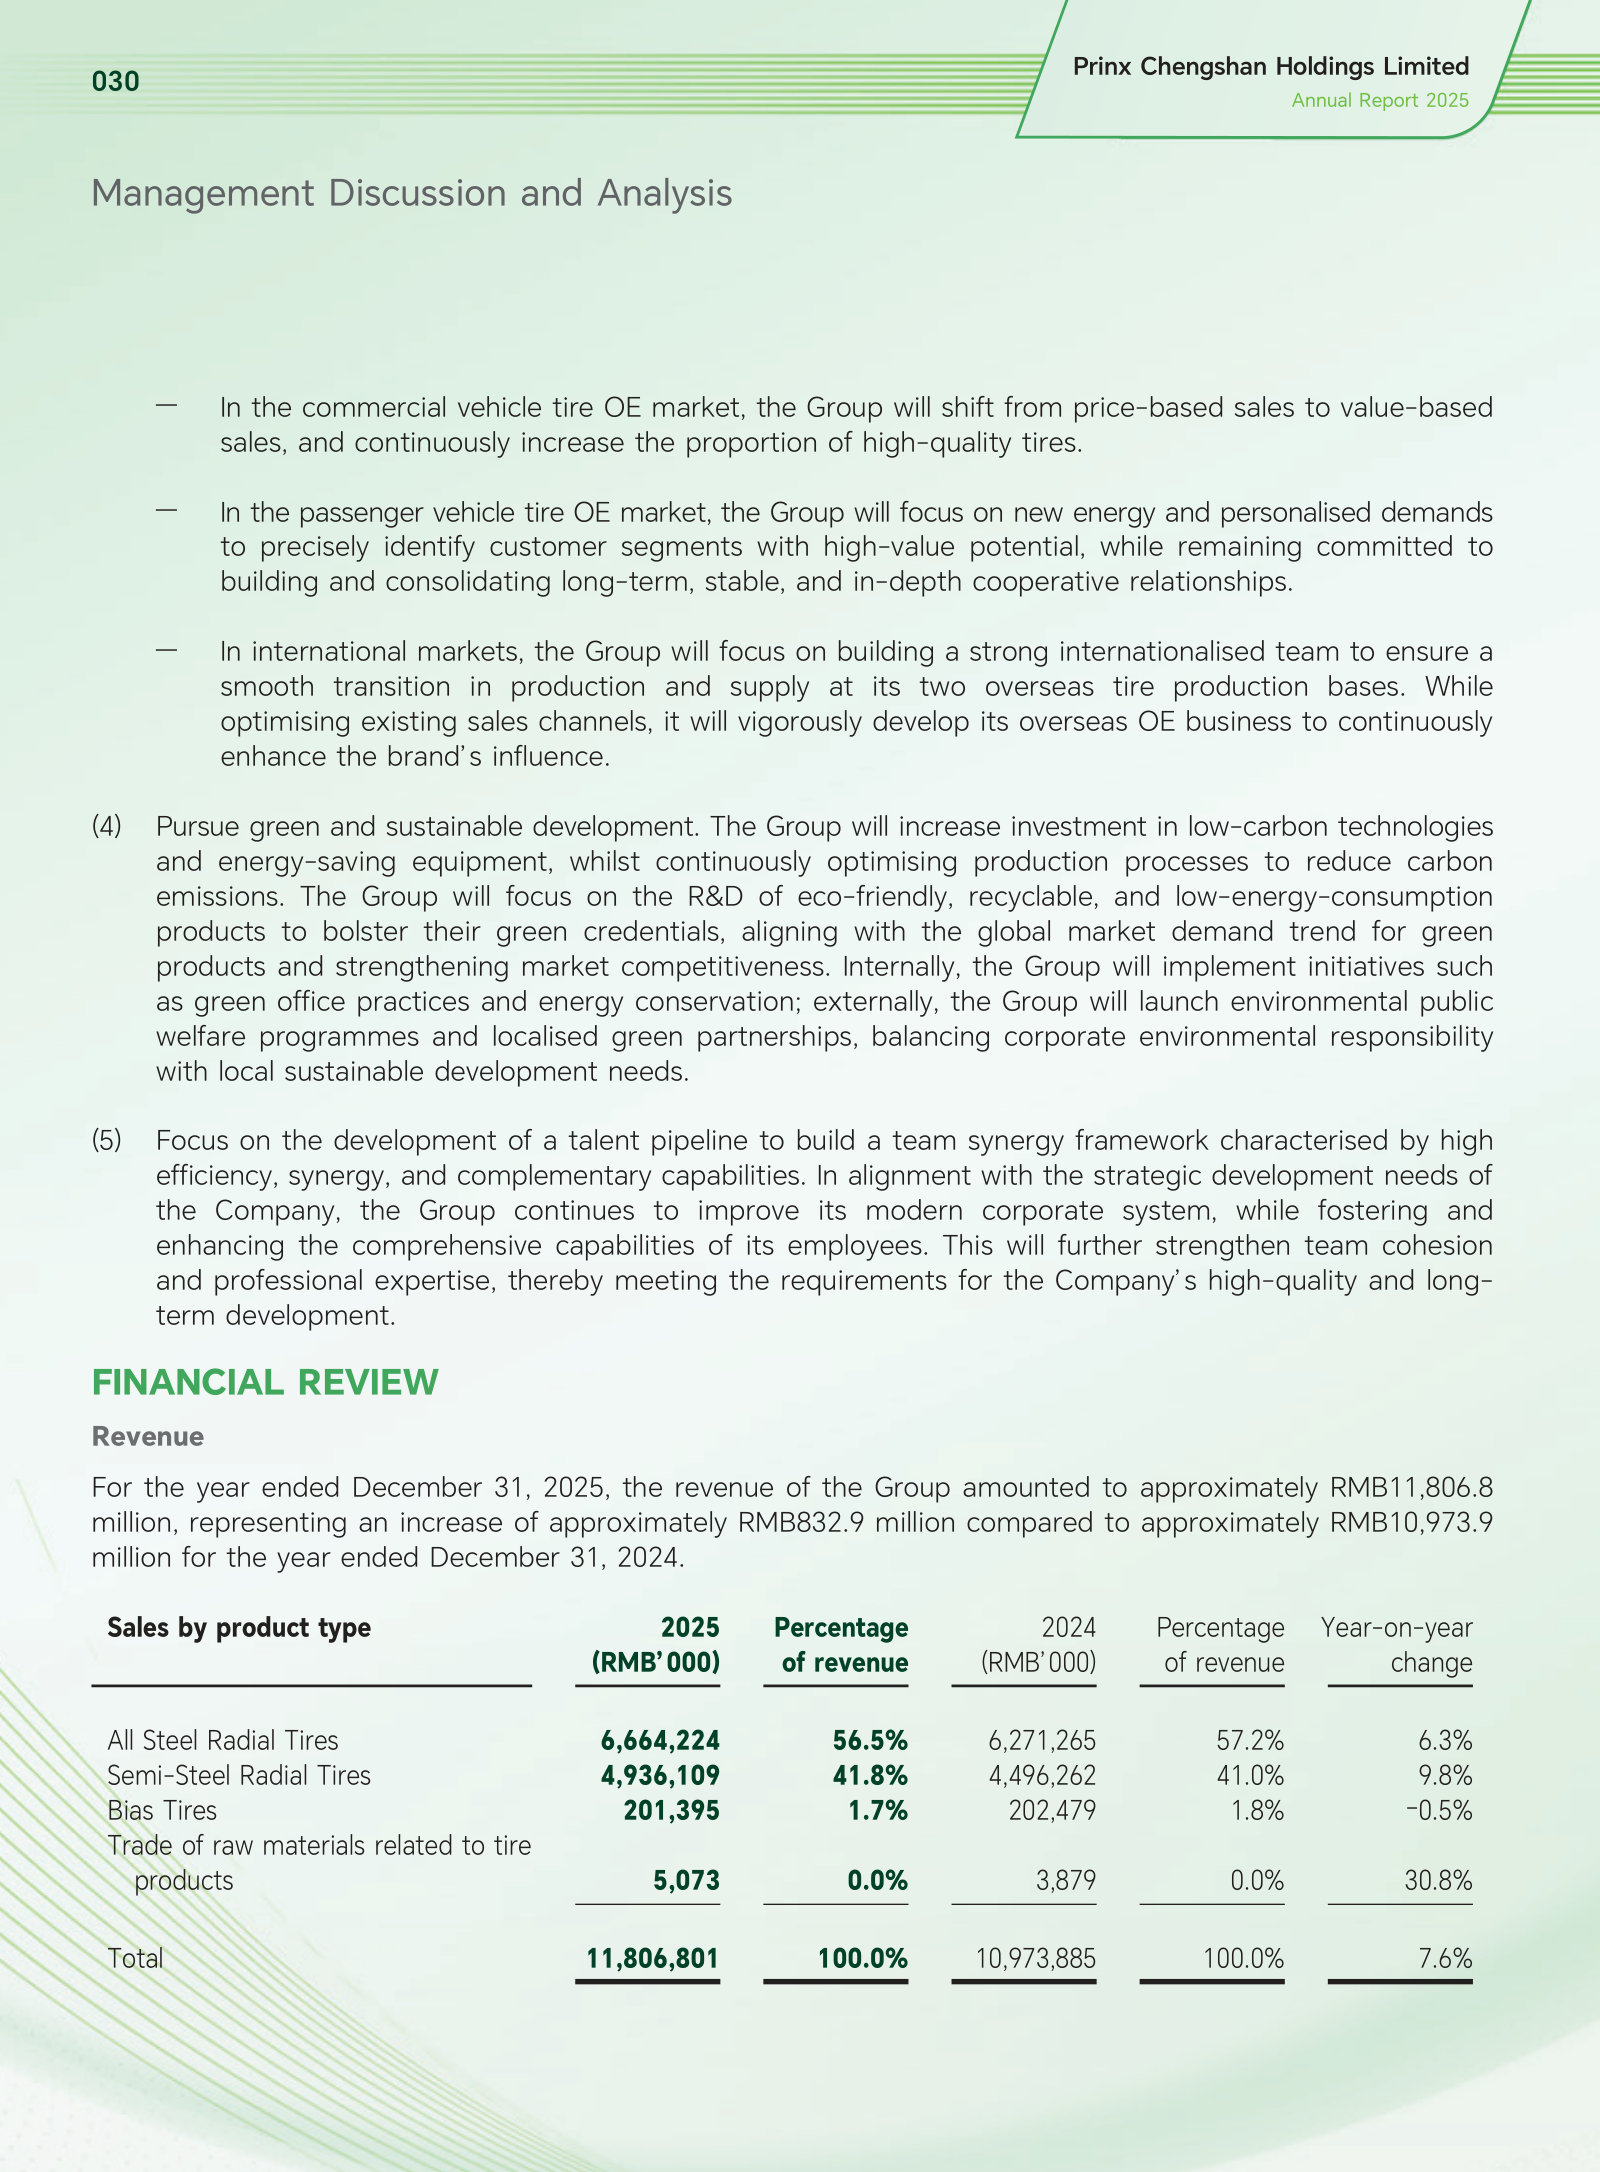
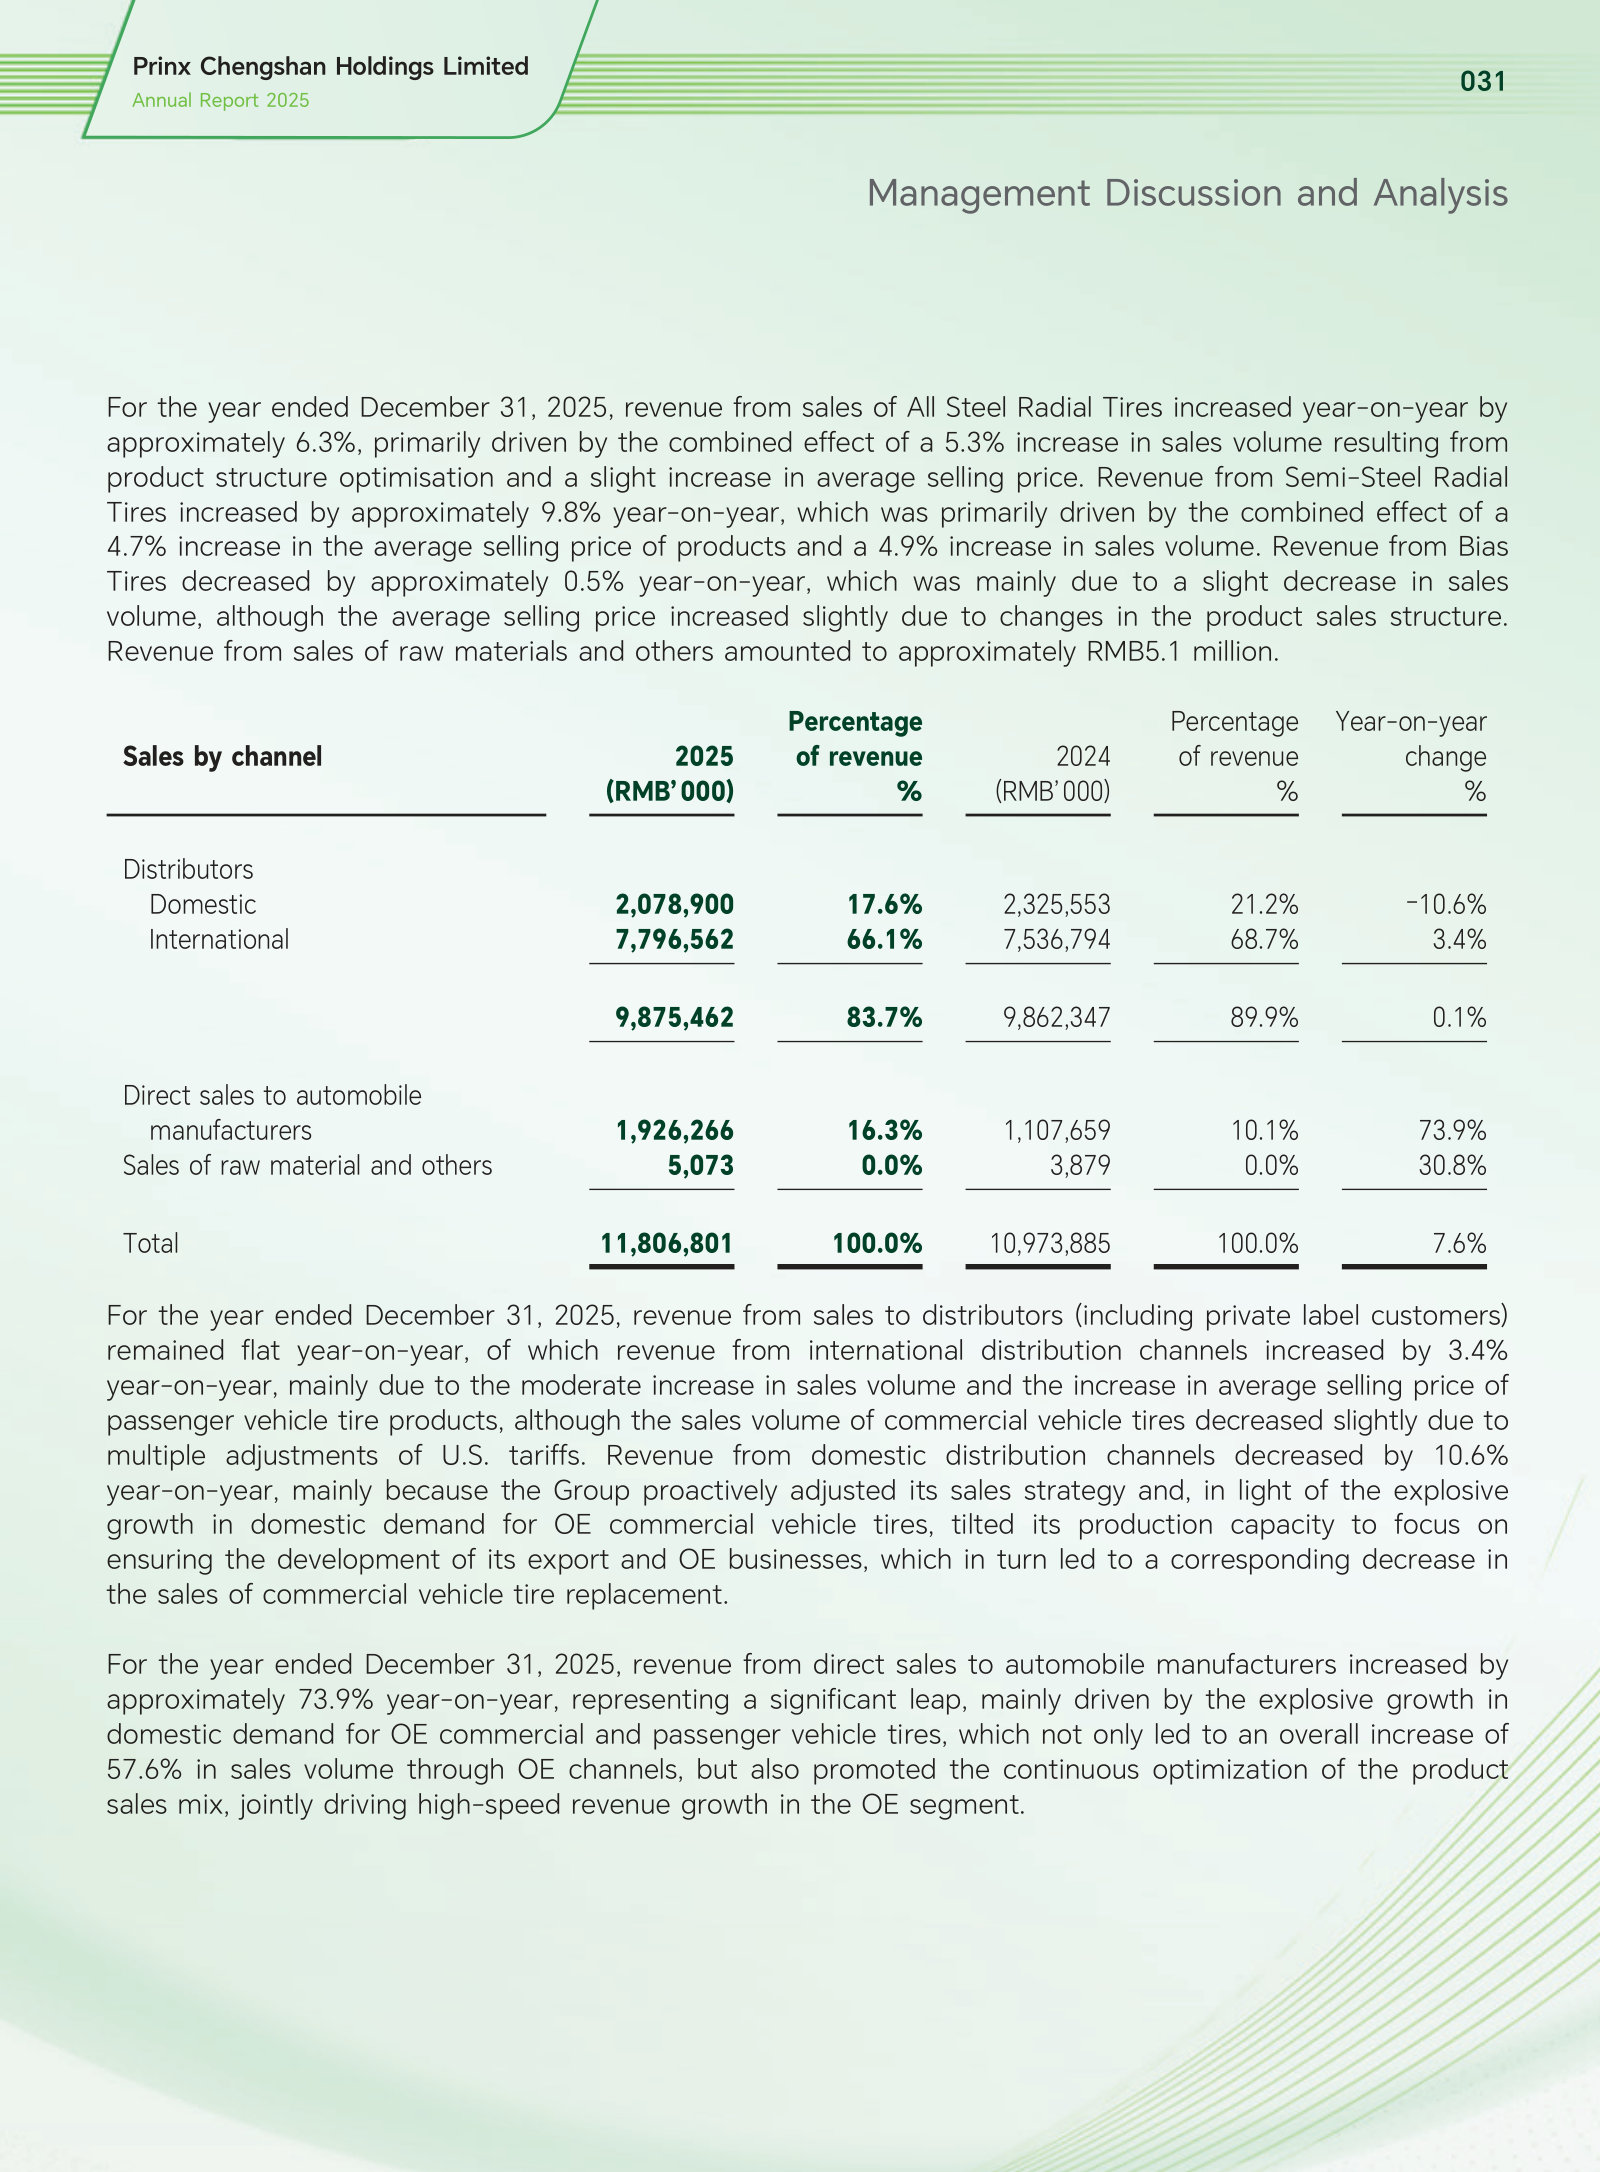
Prinx Chengshan Holdings Limited's annual reports contain management's most considered account of the business. These are the sections, passages and visual pages worth opening in the originals preserved in Sources.
Prinx Chengshan Holdings Limited — FY2025 Annual Report — FY2025
A year when volume and revenue rose but margin fell, and the third production base moved from plan to construction. · Open the full document →
Financial Highlights — p. 5 · Read the full section →
Five-year P&L and ratio series — the only place the full tyre cycle, from the 2021–22 trough to the 2024 peak, is visible at once.
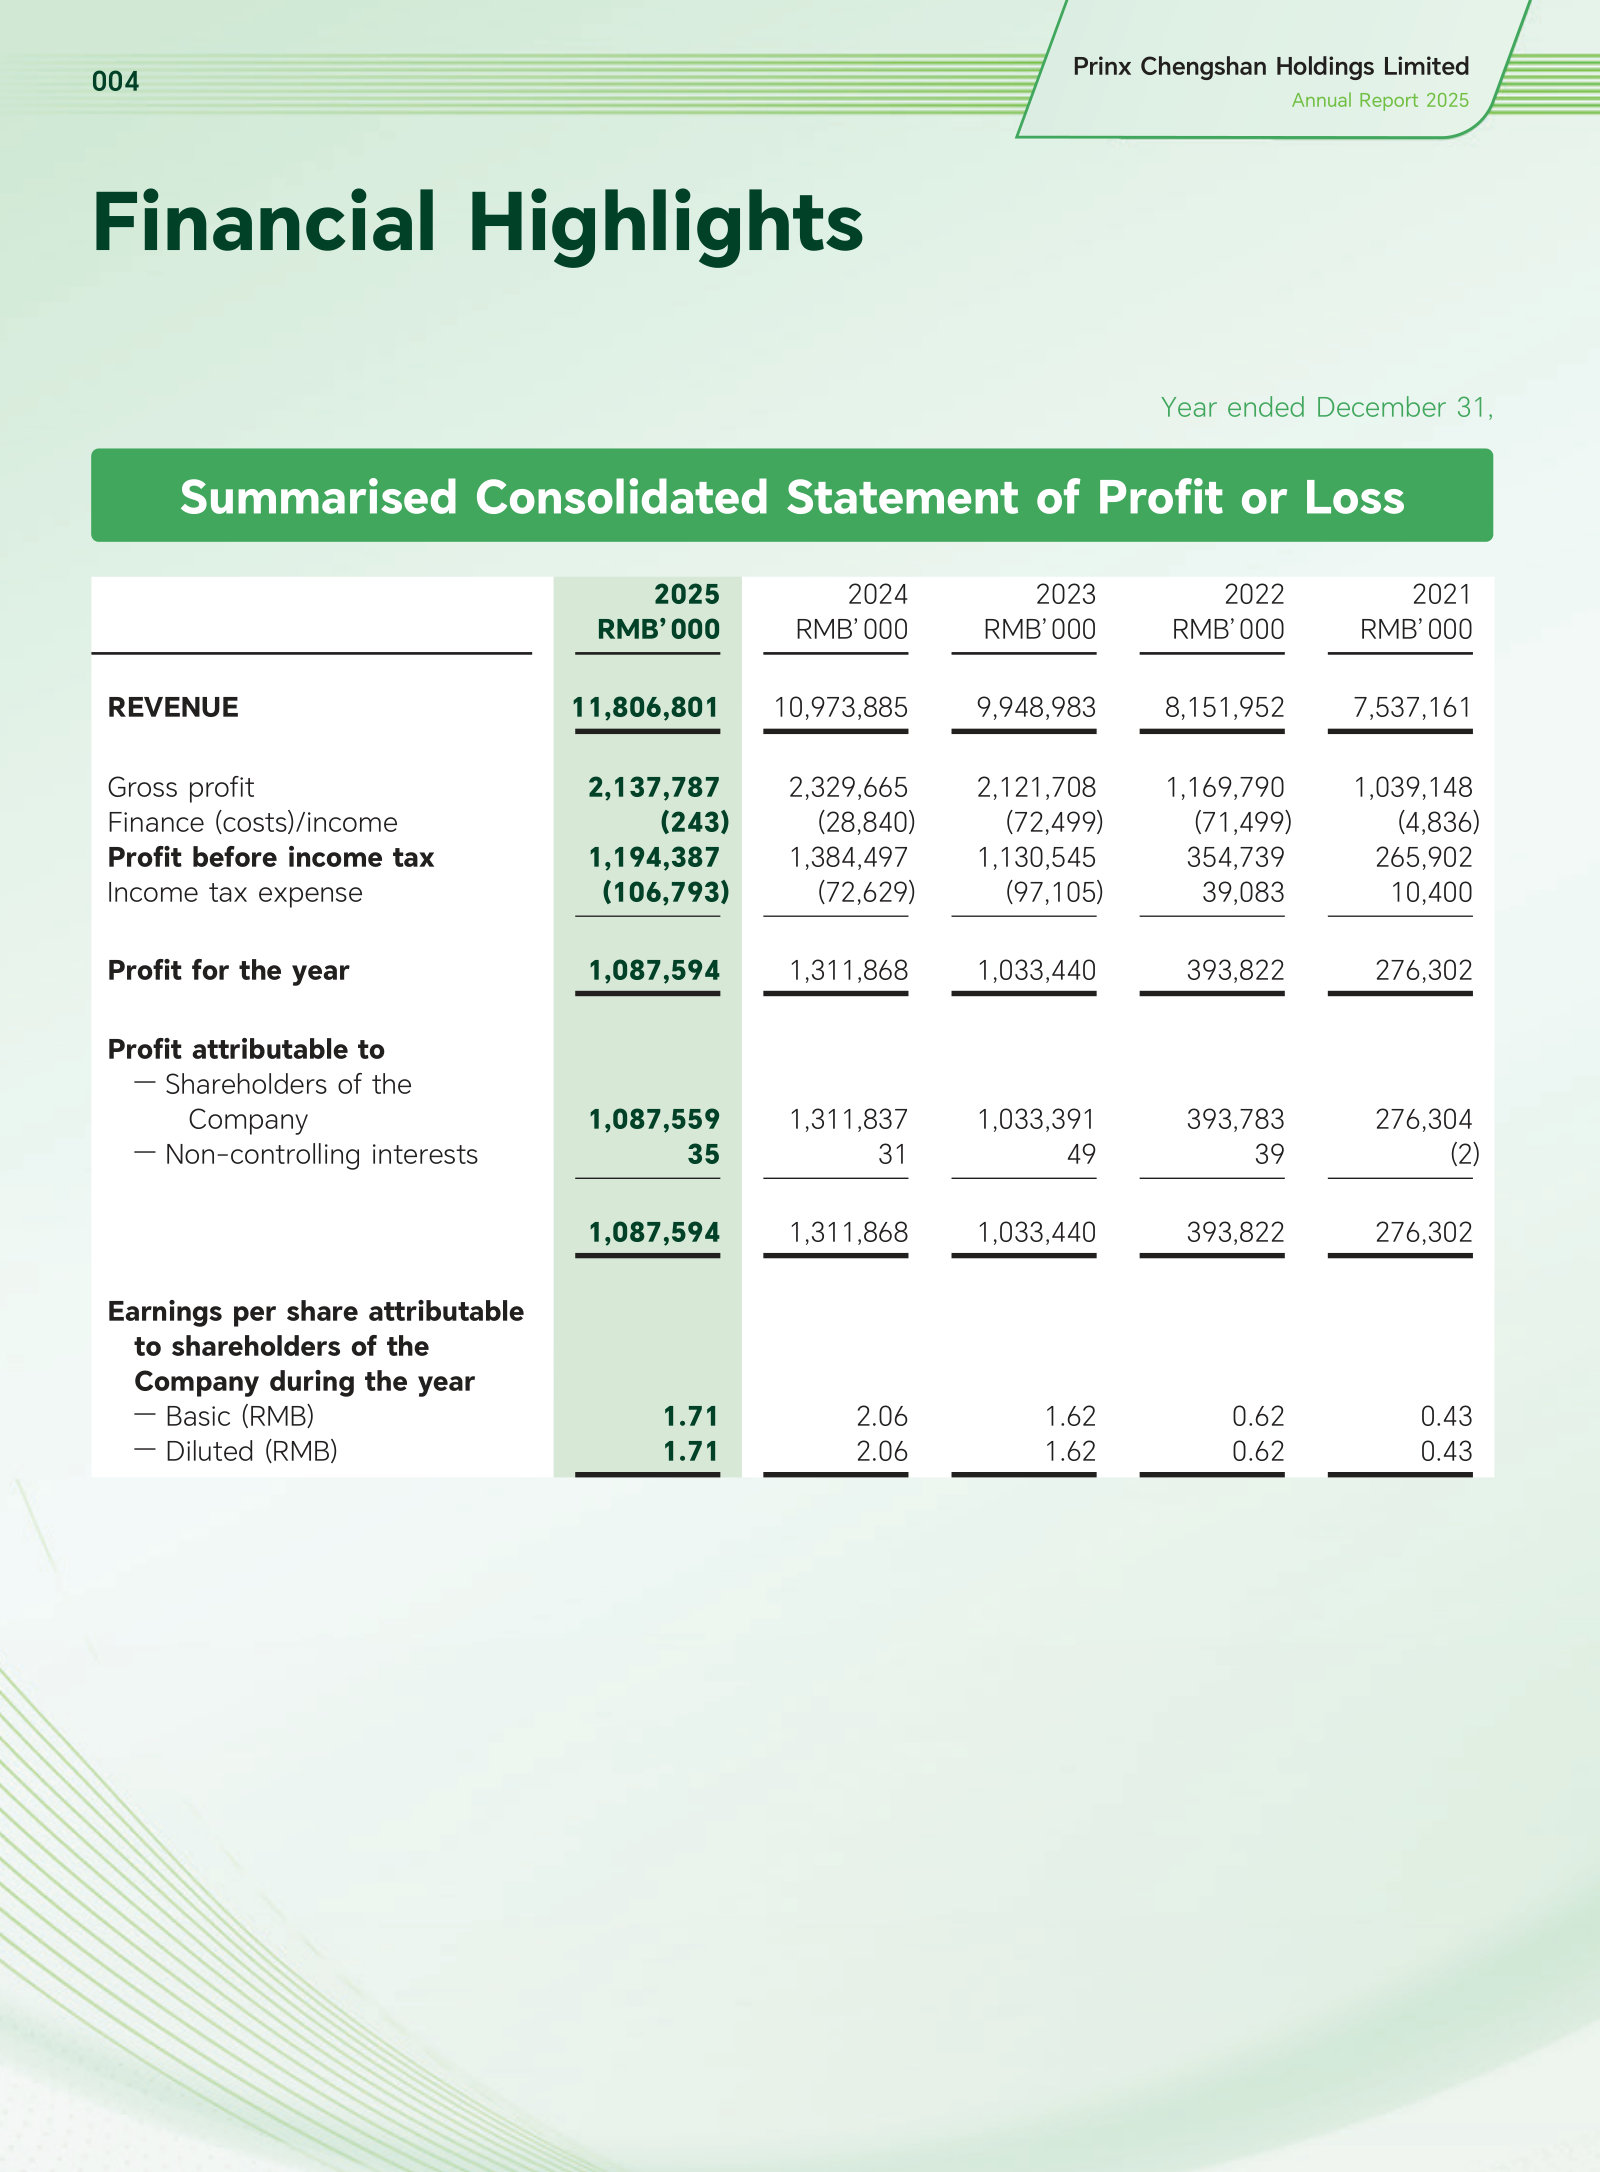
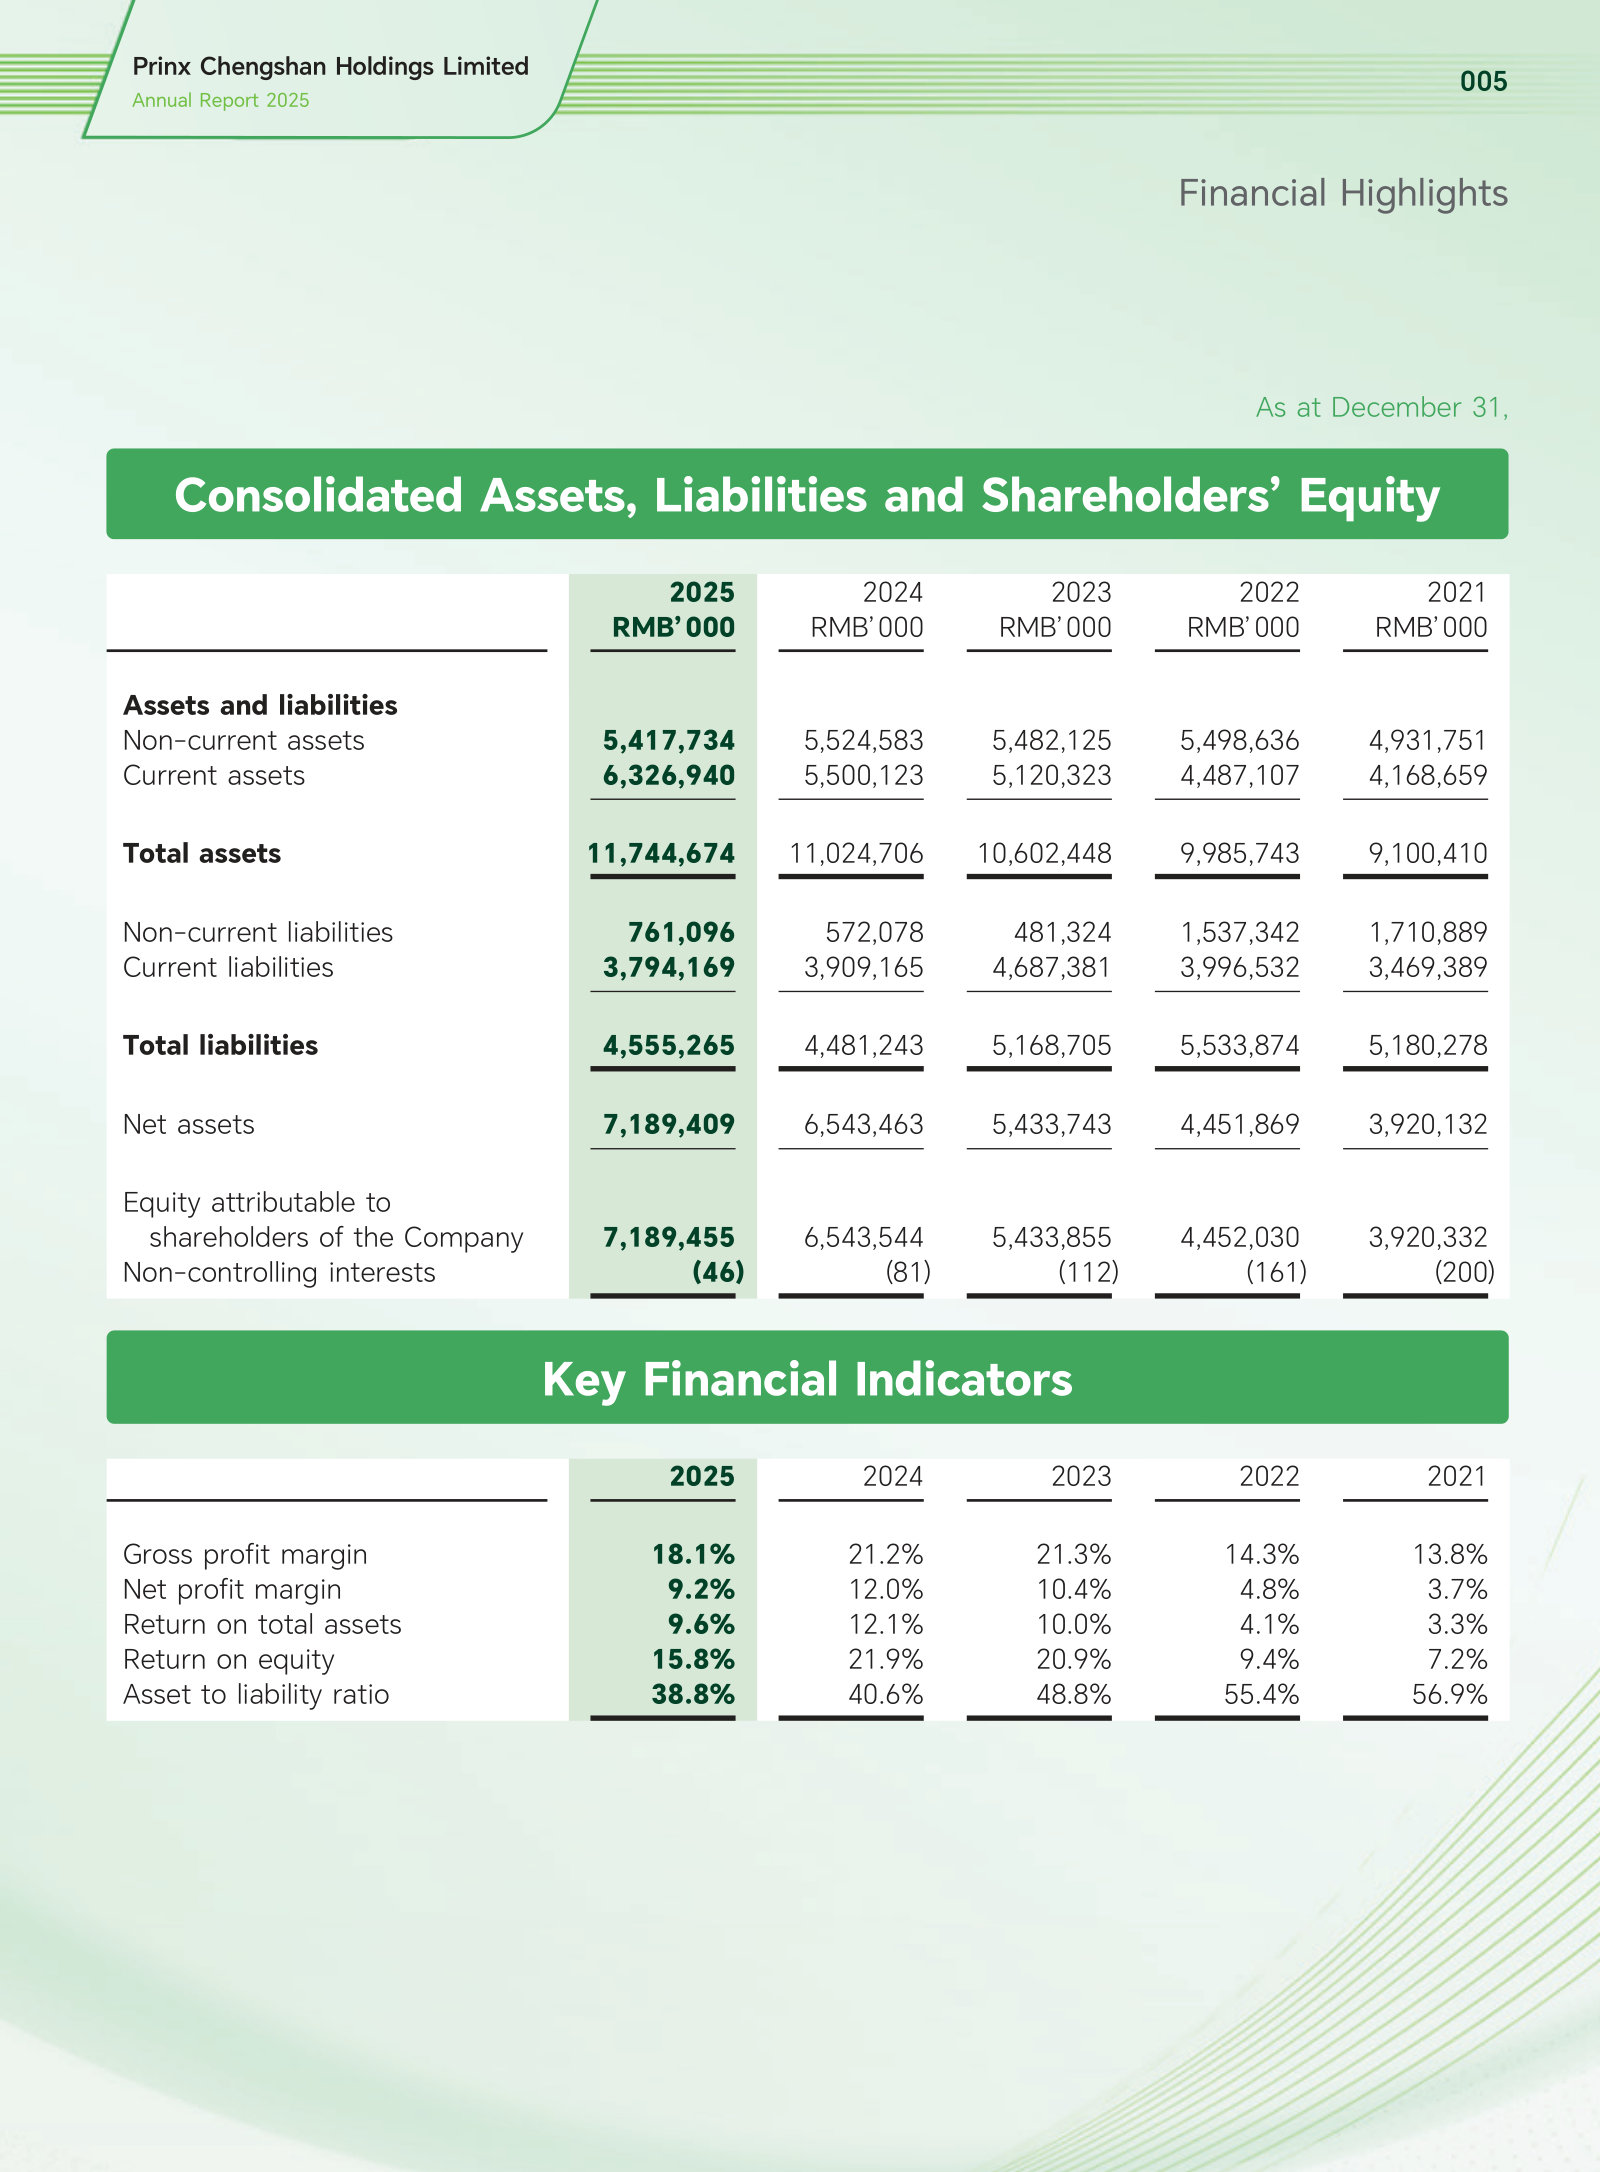
Overview of the Group — p. 8 · Read the full section →
The company's own definition of what it is, where it manufactures, and the three product families that carry the revenue.
Business description and the four core strategies, including the Malaysia base under construction.
The business of Prinx Chengshan Holdings Limited (the “Company” or “Prinx Chengshan”) started in 1976 and is headquartered in Rongcheng City, Shandong Province, the PRC. It is a modern enterprise focusing on tire design, research and development, manufacturing, sales and provision of tire life-cycle services. It is a leading domestic manufacturer in the commercial all steel radial tire replacement market and one of the most influential tire enterprises in the PRC. Over the years, Prinx Chengshan has adhered to the core strategies of “cost leadership, efficiency driven, competitive differentiation and global operation” to strive for global development, possesses two major production bases in China and Thailand, two major R&D centres in Qingdao and Rongcheng (China), and has established three major sales centres in China, North America and Europe and commenced the construction for a third production base in Malaysia to develop a global business operation.
p. 8 · Read in context →
The three product families, their end-use vehicles, and the four brands.
The three major products of the Company and its subsidiaries (the “Group”) are all steel radial tires (“All Steel Tires”), semi-steel radial tires (“Semi-Steel Tires”), and bias tires (“Bias Tires”). All Steel Tires are mainly used in medium/long-distance transportation, buses, mixed road or off-road vehicles, light trucks, etc.; Semi-Steel Tires are mainly used in passenger vehicles, pick-up trucks, sport utility vehicles (SUVs) and other types of vehicles; Bias Tires are mainly installed in vehicles in agricultural and industrial off-road conditions. The Group’s products have obtained certifications from relevant authorities in major tire markets around the world, including Department of Transportation of the USA (“DOT”), Economic Commission of Europe (“ECE”) R117, etc. […] The Group has four well-known tire brands, namely Prinx (浦林), Chengshan (成山), Austone (澳通) and Fortune (富神).
p. 9 · Read in context →
Chairman's Statement — p. 10 · Read the full section →
Management's own framing of a year in which volume grew and profit fell, with the headline figures it chose to lead on.
FY2025 results as the Chairman presents them: 29.3m tyres sold, revenue +7.6%, profit attributable -17.1%.
Looking back on 2025, China’s tire industry faced a complex landscape characterized by a high degree of external uncertainty. Market competition became increasingly fierce, putting pressure on the industry’s overall profitability. Faced with challenging operating environment, we maintained our strategic focus throughout the year by implementing five key initiatives: “Strengthening the Foundation, Building Momentum, Paving the Way, Consolidating the Base, and Gathering Strength”. Over the year, we sold 29.3 million tires, a year-on-year increase of 4.7%, achieving total revenue of RMB11.8 billion, a year-on-year increase of 7.6%. During the Reporting Period, due to the ongoing escalation of international trade barriers, geopolitical fluctuations and uncertainties related to relevant policies, the Company’s profitability metrics experienced periodic fluctuations year-on-year: EBITDA (Note 1) reached RMB1.77 billion, a year-on-year decrease of 11.1%; profit attributable to shareholders for the year was RMB1.088 billion, a year-on-year decrease of 17.1%; and basic earnings per share were RMB1.71, a year-on-year decrease of 17.0%. Although profitability metrics experienced slight fluctuations, core operating indicators remained robust. The Company’s asset-liability ratio was maintained at a healthy level of 38.8%, fully demonstrating the Group’s strong financial resilience and risk resistance capabilities, providing a solid financial foundation and support for subsequent global expansion and business growth. The Board has proposed a final dividend of HK$0.5 per share to share the fruits of development with all shareholders.
p. 10 · Read in context →
OPERATION REVIEW — p. 14 · Read the full section →
Volume by product and revenue by channel — where the OE surge and the domestic replacement decline first appear together.
Sales volume by tyre type and revenue by channel, with the Shandong/Thailand revenue split.
In 2025, the Group sold approximately 29.3 million sets of tires, representing a year-on-year increase of 4.7%. Among them, sales of All Steel Radial Tires amounted to approximately 8.4 million sets, representing a year-on-year increase of 5.3%; sales of Semi-Steel Radial Tires amounted to approximately 20.4 million sets, representing a year-on-year increase of 4.7%; sales of Bias Tires amounted to approximately 0.5 million sets, representing a year-on-year decrease of 1.3%. […] The Group mainly supplies the replacement market through distributors. As of the Reporting Period, the Group’s revenue from domestic distributor channels (including private label customers) amounted to approximately RMB2,078.9 million (2024: approximately RMB2,325.6 million), representing a year-on-year decrease of 10.6%; the revenue from international distributor channels amounted to approximately RMB7,796.6 million (2024: approximately RMB7,536.8 million), representing a year-on-year increase of 3.4%; and the revenue from direct sales to automobile manufacturers amounted to approximately RMB1,926.3 million (2024: approximately RMB1,107.7 million), representing a year-on-year increase of 73.9%. Among them, All Steel Radial Tires and Semi-Steel Radial Tires accounted for approximately 56.5% and 41.8% (2024: 57.2% and 41.0%) of the Group’s revenue, respectively, while Bias Tires accounted for approximately 1.7% (for the same period of 2024: 1.8%); the revenue from the tire production base in Shandong (hereinafter referred to as the “Tire Production Base in Shandong”) and the tire production base in Thailand (hereinafter referred to as the “Tire Production Base in Thailand”) of the Group accounted for approximately 62% and 38% of the Group’s revenue, respectively (for the same period of 2024: 62% and 38%).
p. 15 · Read in context →
(VI) Production capacity — p. 23 · Read the full section →
Installed capacity and utilisation by base, plus the August 2025 Thai production suspension — the year's main operating disruption.
Capacity and utilisation rates at the Shandong and Thailand bases, against 2024.
The Group's Tire Production Base in Shandong currently has a production capacity of 7.4 million sets of All Steel Radial Tires and 11.53 million sets of Semi-Steel Radial Tires per year, and the Tire Production Base in Thailand currently has a production capacity of 2 million sets of All Steel Radial Tires and 10 million sets of Semi-Steel Radial Tires per year. During the Reporting Period, the capacity utilisation rates of All-Steel Radial Tires/Semi-Steel Radial Tires at the Tire Production Base in Shandong were 93.8%/92.6% respectively (82.6%/97.8% for the same period of 2024), and the capacity utilisation rates of All-Steel Radial Tires/Semi-Steel Radial Tires at the Tire Production Base in Thailand were 80.6%/92.5% respectively (87.1%/97.2% for the same period of 2024).
p. 23 · Read in context →
The Thai regulatory suspension, rectification and resumption of production in September 2025.
In August 2025, Prinx Chengshan Tire (Thailand) Co., Ltd. (“Prinx Thailand”), a wholly-owned subsidiary of the Company, received a notice of temporary suspension of production from the Industrial Estate Authority of Thailand due to matters concerning the acceptance of waste treatment and emissions at its Thai production base. Following active rectification and communication, the local competent authorities agreed to resume trial production from August 8, 2025 to September 4, 2025 (inclusive) to complete the testing and acceptance of relevant environmental protection equipment. During the period, the Company strictly implemented various rectification measures in accordance with the requirements of local laws and regulations, completed all rectification work on September 4, 2025, and obtained formal approval for the full resumption of normal production on September 5, 2025. The relevant matters have been properly resolved and have not had a material adverse effect on the business operations and financial position of the Group. Through this incident, the Group has further strengthened its environmental compliance management system and comprehensively enhanced its production and operation standards and internal control levels. During routine inspections, the Industrial Estate Authority of Thailand fully recognized the effectiveness of the rectification and issued the “Eco-Champion” environmental certification certificate signed by the Minister of Industry of Thailand to commend the Company’s proactive performance in compliance rectification and sustainable development.
p. 23 · Read in context →
BUSINESS STRATEGIES AND PROSPECTS — p. 30 · Read the full section →
The forward statement is specific: orders diverge by base and by tyre type, which is more informative than the usual outlook boilerplate.
Order book by base and tyre type as at the report date, and the pressures management names.
As at the date of this report, the Group's overall orders generally remained stable, while the order structure of its domestic and overseas production bases showed a diverging trend. In particular, the orders for All-Steel Tires from the Production Base in Shandong were sufficient, while its orders for Semi-Steel Tires decreased. The orders for All-Steel Tires from the Tire Production Base in Thailand were slightly weak, while its orders for Semi-Steel Tires remained at a normal level. The industry's current development presents both challenges and opportunities. On the one hand, persistent geopolitical conflicts and escalating international trade barriers may exacerbate inflationary pressures and the trend towards downgraded consumption in the European and U.S. markets. While this brings uncertainty to the industry as a whole, it also creates opportunities for high-quality Chinese manufacturing enterprises to capture global market share. On the other hand, factors such as volatile raw material prices and obstructed exports in certain regions also place certain pressures on the Group's operations.
p. 30 · Read in context →
FINANCIAL REVIEW — p. 31 · Read the full section →
Management's explanation of the channel mix shift: capacity deliberately moved away from domestic replacement toward export and OE.
Why domestic distributor revenue fell 10.6% while direct sales to automakers rose 73.9%.
For the year ended December 31, 2025, revenue from sales to distributors (including private label customers) remained flat year-on-year, of which revenue from international distribution channels increased by 3.4% year-on-year, mainly due to the moderate increase in sales volume and the increase in average selling price of passenger vehicle tire products, although the sales volume of commercial vehicle tires decreased slightly due to multiple adjustments of U.S. tariffs. Revenue from domestic distribution channels decreased by 10.6% year-on-year, mainly because the Group proactively adjusted its sales strategy and, in light of the explosive growth in domestic demand for OE commercial vehicle tires, tilted its production capacity to focus on ensuring the development of its export and OE businesses, which in turn led to a corresponding decrease in the sales of commercial vehicle tire replacement. For the year ended December 31, 2025, revenue from direct sales to automobile manufacturers increased by approximately 73.9% year-on-year, representing a significant leap, mainly driven by the explosive growth in domestic demand for OE commercial and passenger vehicle tires, which not only led to an overall increase of 57.6% in sales volume through OE channels, but also promoted the continuous optimization of the product sales mix, jointly driving high-speed revenue growth in the OE segment.
p. 32 · Read in context →
Investments — p. 36 · Read the full section →
The two capital projects that will shape the next three years: the Malaysia base and the Shandong OTR plant, with cost and timing.
Malaysia base: USD299m, 6m semi-steel and 600k all-steel sets a year, trial production expected Q4 2026.
According to the Group's global capacity layout strategy, the Group is establishing a second overseas production base in Kedah Rubber City within the Northern Corridor Economic Region (NCER) of Malaysia. The capacity plan is for 6 million sets of Semi-Steel Radial Tires per year and 600 thousand sets of All Steel Radial Tires per year, with a total investment of USD299 million, which will be funded by the Group's internal resources and external financing. The Tire Production Base in Malaysia commenced construction in the third quarter of 2025. Currently, the land survey, preliminary approval applications and construction design have been completed, and construction is underway, with trial production expected in the fourth quarter of 2026. From 2027 to 2028, production capacity will be gradually released, with an annual output value of approximately USD270 million after reaching full capacity.
p. 36 · Read in context →
Shandong OTR project: RMB1.11bn, first 30.00R51 giant off-road tyre off the line January 19, 2026.
At the same time, according to the structural layout of “Emerging Markets + High-End Categories”, the Group is establishing the Shandong OTR project. The OTR project is located within the Green Tire Intelligent Manufacturing Industrial Park in Rongcheng, Shandong Province, situated on the north side of the existing Tire Production Base in Shandong. It covers an area of 104 thousand square meters, with a planned production capacity of 84 thousand high-performance engineering radial tires per year and 10 thousand giant engineering radial tires per year. The total investment for the OTR project is expected to be RMB1.11 billion, with construction beginning in the second quarter of 2025. It is anticipated to reach a designed capacity of 50 thousand tons of the OTR per year by 2029, with an annual output value of approximately RMB1 billion. The OTR project will fill the gap in domestic high-end engineering tires and achieve structural upgrading. Trial production for the OTR project commenced in the fourth quarter of 2025, and the first 30.00R51 giant off-road tire was successfully rolled off the production line on January 19, 2026.
p. 37 · Read in context →
RISKS AND UNCERTAINTIES — (III) Impacts caused by tariff and anti-dumping and countervailing duty imposed by international markets on products imported from the PRC and Thailand — p. 38 · Read the full section →
Trade duties are the risk that already shows up in the accounts, and the EU case opened in 2025 reaches the Shandong base directly.
US anti-dumping duty of 12.33% on truck and bus tyres from Thailand, now under first administrative review.
Furthermore, on November 7, 2023 (U.S. time), the U.S. Department of Commerce announced to initiate an anti-dumping investigation against Truck and Bus Tires imported from Thailand. The investigation period of the original investigation was from October 1, 2022 to September 30, 2023. Prinx Thailand participated in this anti-dumping investigation and submitted its defense as a compulsory respondent. On October 10, 2024, the U.S. Department of Commerce announced the final determination of the anti-dumping investigation on Truck and Bus Tires from Thailand, and the Group is subject to a tax rate of 12.33%. As the anti-dumping duty order has been officially implemented for over one year, Prinx Thailand has timely submitted an application for the first review to the U.S. Department of Commerce in accordance with relevant U.S. regulations regarding annual administrative reviews of anti-dumping duty orders. Currently, the case is still under further review.
p. 39 · Read in context →
EU anti-dumping and countervailing investigations into Chinese passenger and light-truck tyres, with import registration from January 2026.
In Europe, on May 21, 2025, the European Union announced the initiation of an anti-dumping investigation against tires for passenger vehicles and light trucks (HS codes 40111010 and 40112010) originating from China, followed by a countervailing duty investigation on November 6, 2025. Both investigations are currently in the normal investigation process. Since January 22, 2026, the European Union has implemented import registration for the tires involved to allow for potential retroactive taxation. The investigation period for the anti-dumping and countervailing duty investigations is from January 1, 2024, to December 31, 2024, while the injury investigation period is from January 1, 2021 to the end of the dumping investigation period. The Group has responded proactively and submitted the relevant responses on time. Despite a certain impact on the Group's Shandong company, the anti-dumping investigation by the EU government has also intensified the industrial transformation of global tire industry. The Group will leverage this opportunity to accelerate the optimisation of industrial structure and product upgrades, strengthen the strategic layout of its overseas bases in Thailand and Malaysia, and comprehensively enhance its core competitiveness and risk resistance in the international market through technological innovation and the improvement of supply chain resilience.
p. 39 · Read in context →
Prinx Chengshan Holdings Limited — FY2022 Annual Report — FY2022
Included for one section: the capacity layout before Malaysia, when the plan was Shandong plus Thailand. · Open the full document →
(6) Capacity layout — p. 24 · Read the full section →
The same section three years earlier: a two-base footprint, and Thai semi-steel utilisation at 57.1% against 92.5% in FY2025.
The Thailand base after phase II: 2.0m all-steel and 8.0m semi-steel sets a year, semi-steel utilisation 57.1%.
In the second half of 2020 and the first half of 2021, the Group successively commenced the production capacity expansion of 1.2 million sets/year of All Steel Radial Tires and 4.0 million sets/year of Semi-Steel Radial Tires of the phase II of the Tire Production Base in Thailand. Currently, the second phase of the project has gradually reached its production capacity in the first quarter of 2022. The Tire Production Base in Thailand has a production capacity of 2.0 million sets of All Steel Radial Tires per year and 8.0 million sets of Semi-Steel Radial Tires per year, which helps the Group to further explore overseas markets such as North America and Europe. During the Reporting Period, the capacity utilization rate of All Steel Radial Tires and Semi-Steel Radial Tires at the Tire Production Base in Thailand was 94.4%/57.1%, respectively.
p. 24 · Read in context →
More annual reports
Prinx Chengshan Holdings Limited — FY2024 Annual Report — FY2024 · 201 pages · The cycle peak and the comparison base for FY2025: gross margin 21.2%, ROE 21.9%, net profit RMB1,311.9 million. · Open →
Prinx Chengshan Holdings Limited — FY2023 Annual Report — FY2023 · 213 pages · The recovery year in which gross margin jumped from 14.3% to 21.3% as raw material and freight costs normalised. · Open →
Prinx Chengshan Holdings Limited — FY2021 Annual Report — FY2021 · 189 pages · The trough edition: 13.8% gross margin, the Thailand phase II ramp, and the expiry of the Cooper supply agreement. · Open →
Competitors describe Prinx Chengshan Holdings Limited's market in their own filings and calls. These verified passages and visual pages show where their strategies meet, using source documents preserved in Sources.
Jiangsu General Science Technology Co., Ltd. (通用股份) (601500.SS)
The closest strategic mirror to Prinx Chengshan, and the only peer whose filings name it. General Science runs the same play: a Chinese all-steel/semi-steel maker whose growth sits in Southeast Asian plants (Thailand and Cambodia) selling into the US and Europe, at roughly Prinx's scale (FY2025 revenue RMB8.50bn against Prinx's RMB11.81bn). Its annual report devotes a standing section to tyre trade barriers and discloses the same US truck-and-bus-tyre anti-dumping proceeding in which Prinx Thailand was a mandatory respondent, plus plant-by-plant utilisation for the offshore bases. Only the tyre business is in scope; the Suhao Holdings parent's wider trading operations are not.
A competitor's trade-barrier section naming Prinx Chengshan. First paragraph: in the US Department of Commerce's October 2024 final determination on truck and bus tyres from Thailand, "Prinx Chengshan (Thailand)" received an individual rate of 12.33%; the other mandatory respondent, Bridgestone (Thailand), was assigned 48.39% at the preliminary stage; and General Science's own Thai base, along with all other Thai exporters, took the 12.33% all-others rate. Prinx's own FY2025 annual report confirms the same 12.33% and adds that it has filed for the first administrative review. The read-across is that Prinx's individual rate became the rate every other Thai exporter pays — its defence as a mandatory respondent set the floor for the peers it competes against out of Thailand, and conferred no relative advantage. Second paragraph, elided to the next sub-heading: from 3 April 2025 tyres fall under the Section 232 national-security regime rather than the reciprocal tariff, with USMCA-qualifying Canadian and Mexican tyres exempt; Chinese-made tyres carry 25% on top of the MFN rate, and Vietnamese, Thai and Cambodian tyres carry the 25% Section 232 duty alone. On this account the tariff gap between exporting from China and exporting from Thailand has narrowed to the MFN rate plus any anti-dumping order. These are General Science's own summaries of US and EU measures, not legal texts, and the rates are as of its FY2025 reporting date.
2024 年 10 月,美国商务部公布对泰国卡车和公交车轮胎反倾销调查终裁结果。浦林成山(泰国)单独税率为 12.33%;另一家强制应诉企业普利司通(泰国)初裁单独税率为 48.39%;公司泰国基地与其他泰国出口美国的轮胎企业初裁税率为 12.33%。 […] 2025 年 4月 3日,美国对轮胎行业实施新的关税政策安排,将轮胎产品纳入 232 国家安全关税适用范围,并明确已适用 232 关税的轮胎产品不再叠加执行全球对等关税。该政策覆盖乘用车轮胎、轻卡轮胎等主要轮胎品类,除符合 USMCA 规则的加拿大、墨西哥产轮胎可豁免 232 关税外,其他国家和地区输美轮胎均适用 232 条款相关关税要求。中国产轮胎在原有最惠国税率基础上,加征 232 条款项下 25%的附加关税,越南、泰国、柬埔寨等东南亚国家产轮胎仅执行 232条款 25%的附加关税,不再适用此前拟定的对等关税税率。
p. 14 · Read in context →
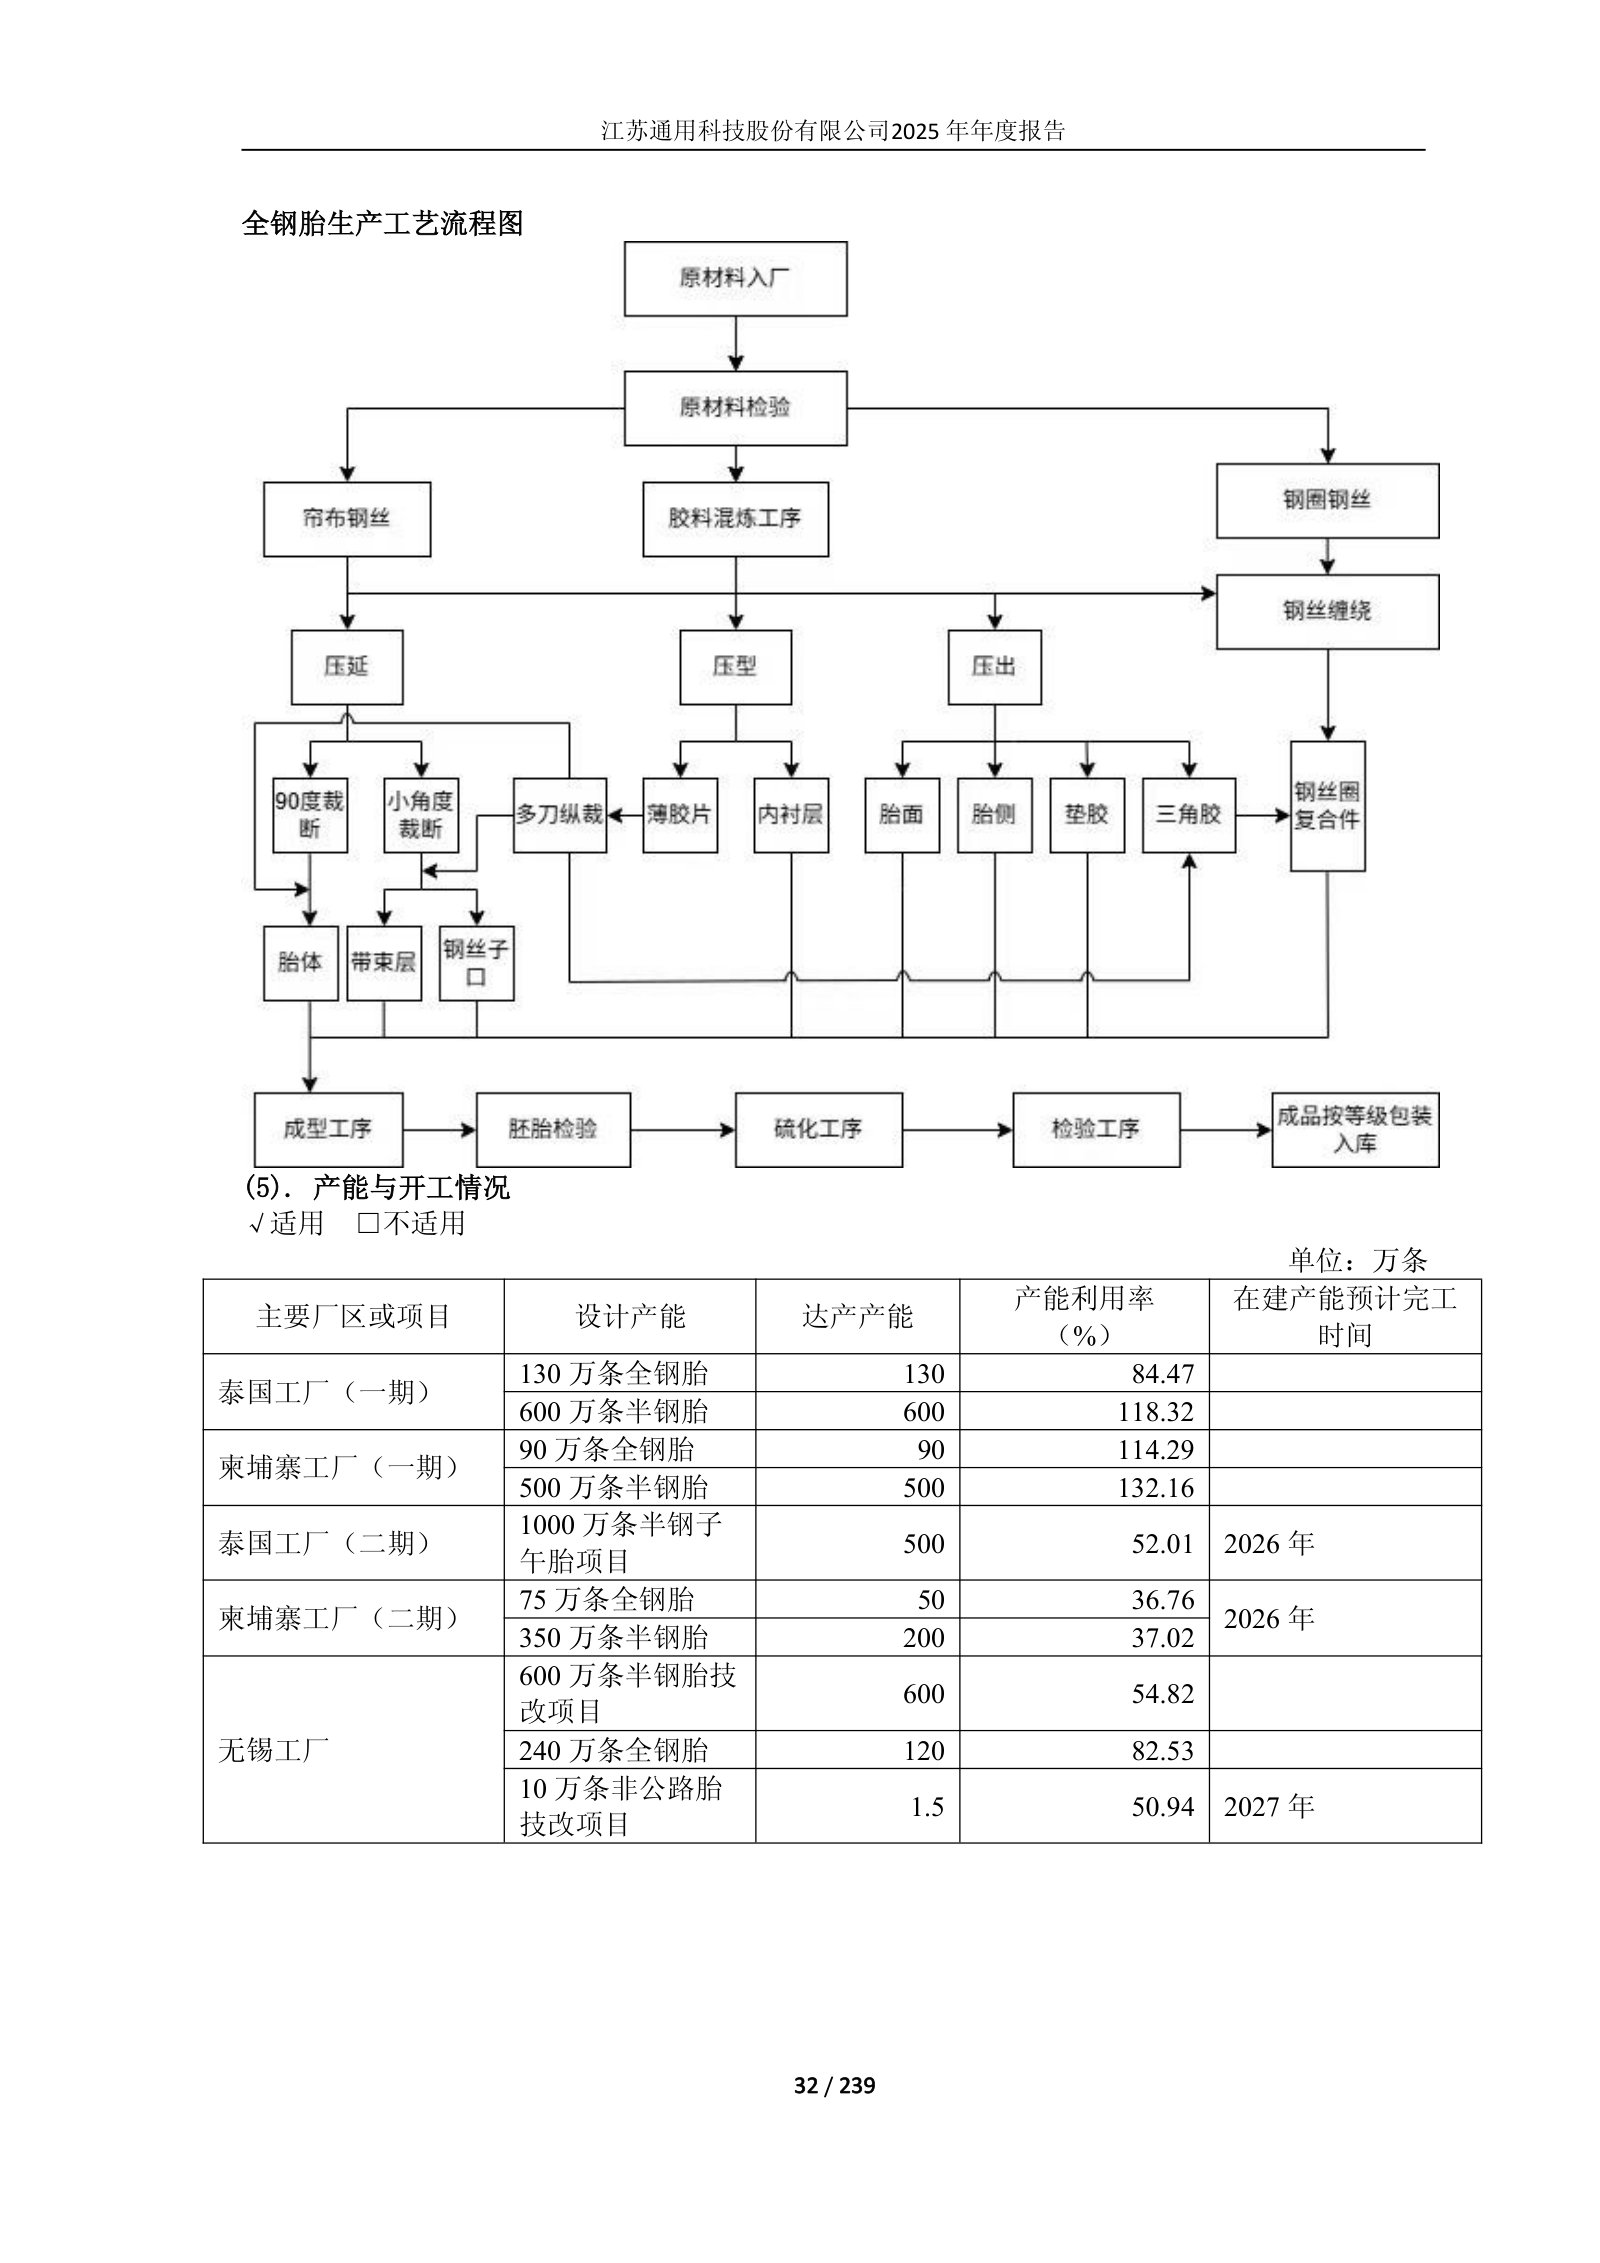
General Science on how it is responding to the tariffs above: leaning on strategic relationships with large overseas customers, flexing production plans and order scheduling to keep the two offshore bases running, and pushing hard into non-US markets — Southeast Asia, South America, Central Asia and Africa — with dedicated market-development teams and localised sales and service networks, explicitly to spread the tariff risk. It describes the Thai base as having built a reputation comparable to international brands after years in market, and the Cambodian plant as running strong on both output and sales with phase 2 capacity coming through. Later on the same page the company says it is actively planning a third overseas base. This is management's own characterisation of its position, with no volumes, prices or margins attached; the checkable part is the strategy — diversify away from the US and add a third country — which is the same move Prinx is making with Malaysia.
公司深化“5X 战略计划”,持续践行全球化布局。面对对等关税压力,公司主动作为、多措并举破解发展困境。公司依托与海外头部客户建立的战略合作关系,灵活调整生产策略和订单排期,保障了海外双基地的稳健运营。
同时,公司积极拓展非美市场,加大对东南亚及南美、中亚和非洲等新兴市场的开拓,组建专项市场拓展团队,深入调研区域市场需求特点,搭建本地化营销与服务网络,不断提升品牌认可度和市场占有率,进一步拓宽全球市场布局,分散关税压力带来的经营风险。公司泰国生产基地经过多年市场验证,凭借高性能、高品质、绿色安全的产品,形成了比肩国际品牌的优质口碑;柬埔寨工厂自开业以来,保持着“产销两旺”的良好态势,二期项目的产能潜力逐步凸显,其全过程自动化、智能化、互联化的制造实力,充分彰显“中国智造”的强劲力量,成为提升公司业绩增长的重要引擎。
p. 15 · Read in context →
Triangle Tyre Co., Ltd. (三角轮胎) (601163.SS)
The nearest peer by size and product mix: a Shandong commercial-tyre house whose FY2025 revenue of RMB9.82bn sits just below Prinx's RMB11.81bn, with tube-less commercial tyres over 70% of its truck range and a replacement-market franchise built on the same dealer model. It is also the control case for the offshore question — Triangle reports overseas assets of RMB61.4m, 0.32% of total assets, so its results isolate what happens to a China-only cost base facing the same tariffs. Its industry section is the most granular market sizing in the peer set.
The shared market, sized by a peer. From the National Bureau of Statistics: industrial revenue across large enterprises grew 1.1% in 2025 while profit grew 0.6%, but the rubber and plastics sector saw revenue fall 1.4% and profit fall 5.9% — the industry earned less on more. Chinese rubber tyre casing output including motorcycle tyres was 1.207bn units, up 0.9%. From the China Rubber Industry Association's tyre branch: total automotive casing output 865m units, up 2.1%, with radialisation at 96%; semi-steel passenger tyres 685m units, up 1.5%; all-steel truck tyres 146m units, up 5.0%. Customs data put 2025 exports of new pneumatic rubber tyres at 702m units, up 3.1%, 9.29m tonnes, up 3.3%, and RMB161.123bn, up 1.8% — value growing more slowly than volume, i.e. falling average export prices. Within that, passenger-car tyre exports fell 1.9% while bus and truck tyre exports rose 2.7%. Note that peers do not agree on these figures: Linglong's FY2025 report puts total automotive tyre output at 834m units, down 1.59%, and all-steel at 149m units, up 7.19%, against Triangle's 865m and 146m. The association and customs series are the common source, but the aggregations differ, so use the direction rather than the decimal.
国家统计局数据显示:2025 年全国规模以上工业企业营业收入同比增长 1.1%,利润总额同比增长 0.6%;其中,橡胶和塑料制品业营业收入同比减少 1.4%,利润总额同比减少 5.9%。2025年我国橡胶轮胎外胎累计产量(包括摩托车充气橡胶轮胎外胎)为 12.07 亿条,同比增长 0.9%。根据中国橡胶工业协会轮胎分会的统计,2025 年全国汽车外胎总产量 8.65 亿条,同比增长 2.1%,子午化率达 96%;其中半钢乘用轮胎产量 6.85 亿条,同比增长 1.5%;全钢载货轮胎产量 1.46 亿条,同比增长 5%。
根据海关总署数据,2025 年全年,我国新的充气橡胶轮胎(含摩托车、自行车等用轮胎)累计出口数量为7.02亿条,同比增长3.1%,出口重量为929万吨,同比增长3.3%,出口金额为1,611.23亿元人民币,同比增长 1.8%;其中:机动小客车用新的充气橡胶轮胎出口数量 3.42 亿条、同比减少 1.9%;客车或货运机动车辆用新的充气橡胶轮胎出口数量 1.30 亿条、同比增长 2.7%;建筑业、采矿业或工业搬运车辆及机器用新的充气橡胶轮胎出口数量 0.1 亿条、同比增长 1.9%。
p. 12 · Read in context →
Triangle's own account of the trade environment and its answer to it: the US reciprocal-tariff policy of April 2025, the EU anti-dumping investigation into Chinese passenger and light-truck tyres opened in May with a countervailing investigation added on 6 November, and rate changes or new tariffs in the UK, Brazil, Mexico and Turkey. Management says the company is "moving from passive response to proactive positioning, addressing trade risk through global capacity deployment and lifting core competitiveness through technical innovation". The second paragraph records the China Rubber Industry Association's 15th Five-Year Plan guidance for the rubber sector, issued in October 2025, built around premiumisation, green transition, intelligent manufacturing and international coordination for 2026-2030. Set the stated intent against the disclosure higher up the same page: overseas assets of RMB61.3932m, 0.32% of total assets. At the FY2025 balance-sheet date the global capacity deployment is an intention rather than a built footprint — which is the structural difference between Triangle and Prinx, whose Thai base already carries 2m all-steel and 10m semi-steel sets of capacity.
2025 年 4月,美国政府宣布实施“对等关税”政策;2025 年 5 月,欧盟启动对华乘用车和轻卡轮胎的反倾销调查后,于 11 月 6日正式追加反补贴调查;英国、巴西、墨西哥、土耳其等国家调整反倾销税率或加征关税,中国轮胎对欧美等国家的出口面临新的挑战。面对日益复杂的国际贸易环境,公司正在从被动应对转向主动布局,通过全球化产能布局应对贸易风险,通过技术创新提升核心竞争力。
2025 年 10 月中国橡胶工业协会正式发布了《橡胶行业“十五五”发展规划指导纲要》,明确了未来五年(2026-2030 年)行业发展的总体定位、核心目标和战略路径。《橡胶行业“十五五”发展规划指导纲要》以“高端化引领、绿色化转型、智能化赋能、国际化协同”为主线,全面贯彻国家“十五五”时期国民经济和社会发展的总体部署。公司将以“十五五”规划为指导,以科技创新为核心驱动,对标世界一流企业标准,通过数字技术赋能智能制造、绿色技术推动低碳转型,实现高质量发展。
## (2).主要细分行业的基本情况及公司行业地位
√适用 □不适用
详见本报告第三节 二、“报告期内公司所处行业情况”。
p. 25 · Read in context →
Sailun Group Co., Ltd. (赛轮轮胎) (601058.SS)
The scale setter. Sailun's FY2025 revenue of RMB36.79bn is roughly three times Prinx's, RMB28.23bn of it earned offshore, and it holds the largest overseas manufacturing footprint of any Chinese tyre company. It competes with Prinx in the same all-steel and semi-steel categories, through the same US and European replacement channels, and out of the same Southeast Asian tariff jurisdictions. Its filings and investor Q&A are also the most explicit peer statements of global market structure and of the tariff arithmetic by country of origin.
Sailun's stated view of global market structure, in the outlook section of its FY2025 annual report. Citing Michelin's annual report, it puts Europe and North America together above 50% of 2025 global tyre sales, China's share up to 20.18%, and Africa, India and the Middle East as the fastest-growing sources of incremental volume. On competition, it argues concentration remains high and the international majors still hold relatively high share, but that the picture has shifted materially: per the US trade publication Tire Business's 2025 Global Tire 75 ranking, the combined global market share of the top three producers has fallen to 35%, and the number of Chinese entrants, including Taiwan, has risen to 39. The framing — Chinese producers rebuilding global share, price and supply chains on cost-performance, R&D spending and offshore capacity — is Sailun's. The two share figures are the checkable part, and both are third-party: 35% for the top three is Tire Business's compilation of 2024 sales, and the regional splits are Michelin's. Neither gives Prinx's own share.
根据米其林年报数据,欧美地区仍是全球轮胎最主要的消费市场,2025 年轮胎销量合计占比超过 50%;中国市场依托汽车产业的快速发展实现规模扩容,轮胎销量占比提升至 20.18%;非洲、印度及中东等新兴市场轮胎需求保持较快增速,已成为轮胎销量增加的重要来源。
从市场竞争格局来看,全球轮胎市场竞争格局仍呈现较高集中度,国际轮胎巨头凭借长期积累的技术、品牌、产能与渠道优势,仍占据相对较高的市场份额。但受全球消费需求结构调整、轮胎企业技术持续突破等因素影响,以中国轮胎制造企业为代表的新兴轮胎品牌加快推进全球化布局,全球轮胎市场格局较之前已有较大变化。根据美国《Tire Business》2025 年发布的全球轮胎企业 75 强榜单数据,全球排名前三的轮胎企业全球市场占有率下降至 35%;中国企业(含中国台湾地区)入围数量增加至 39 家。中国轮胎企业凭借高性价比优势、持续加码的技术创新投入,以及稳步推进的全球化布局,全球市场影响力逐步提升,推动全球轮胎行业市场份额、销售价格与供应链不断重构。
p. 43 · Read in context →
The capacity build a Prinx reader is competing against, in Sailun's own words. Existing bases: Qingdao, Dongying, Shenyang and Weifang in China; Vietnam, Cambodia, Mexico and Indonesia offshore; Egypt and Qingdao Dongjiakou under construction. The 2025 timeline it lists: January, a 1.65m-unit all-steel expansion in Cambodia; May, first tyres off the line in both Indonesia and Mexico; August, an Egyptian project of 3m semi-steel and 600k all-steel units; September, 3.3m all-steel and 20k tonnes of off-road capacity at the Shenyang Xinheping plant; November, 51.4k tonnes of off-road capacity at Weifang. It then carries post-period events: in January 2026 Indonesia was re-scoped to 6m semi-steel, 750k all-steel, 10k tonnes off-road and 1.5m inner-tube sets; in April 2026 a further 7.05m-unit Egyptian expansion taking that plant to 9m semi-steel and 1.65m all-steel. These are announced project scopes and investment decisions, not commissioned or utilised capacity, and several are 2026 events disclosed in a FY2025 report. Prinx's entire overseas footprint is a Thai base of 2m all-steel and 10m semi-steel sets, with Malaysia under construction.
作为中国首家出海建厂的轮胎企业,公司始终坚定践行全球化发展战略,持续迭代智能制造水平,为全球用户提供高性能轮胎产品。目前,公司已在国内青岛、东营、沈阳、潍坊及海外越南、柬埔寨、墨西哥、印尼布局多个轮胎生产基地,埃及与青岛董家口生产基地建设正稳步推进。
报告期内,公司在海外产能建设、国内布局完善、产业协同深化等多维度实现全面突破,为公司全球供应链稳定与产品研发创新筑牢发展根基。1 月,公司在柬埔寨投资扩建年产 165 万条全钢胎项目;5 月,印尼、墨西哥生产基地相继实现首胎下线,目前产能持续提升;8 月,在埃及投资建设年产 300 万条半钢胎及 60 万条全钢胎项目;9月,在沈阳新和平工厂投资建设年产 330万条全钢胎及 2 万吨非公路轮胎项目;11 月,在潍坊工厂投资建设年产 5.14 万吨非公路轮胎项目。2026 年 1月,公司将印尼工厂的年产能调整为 600 万条半钢胎、75 万条全钢胎、1 万吨非公路轮胎及 150 万套内胎及垫带。2026 年 4月,公司又在埃及投资建设年产 705 万条子午线轮胎扩建项目,项目建设完成后,埃及工厂将具备年产 900 万条半钢子午线轮胎及 165 万条全钢子午线轮胎的生产能力。
p. 18 · Read in context →
Two answers from Sailun's 1 September 2025 investor briefing, the clearest peer statement of both offshore scale and the tariff map. First: total planned overseas capacity of 9.75m all-steel radial tyres, 49m semi-steel radial tyres and 137,000 tonnes of off-road tyres a year, which the company claims makes it the Chinese tyre producer with the largest overseas footprint. The number is planned rather than installed capacity, and the ranking claim is Sailun's own and unsourced. Second, answering a question about why first-half net profit fell: semi-steel tyres shipped from Mexico to the US qualify for USMCA duty-free treatment; passenger and light-truck tyres from Vietnam, Cambodia and Indonesia carry the 25% Section 232 auto-parts rate; and other tyre products from those countries carry reciprocal tariffs of 19% for Cambodia and Indonesia and 20% for Vietnam. Read against Prinx, whose only operating offshore base is in Thailand and whose Thai truck-and-bus tyres carry a 12.33% anti-dumping duty on top of Section 232, this is a competitor describing a materially more diversified set of origins to ship from. The rates are as stated on 1 September 2025 and are management's summary, not a customs schedule.
Sailun investor relations record, online results briefing of 1 September 2025 — investor questions 26 and 27, answered by the company: ## 26、请问公司目前已投产产能和在建产能情况?海外产能占比是多少?谢谢
答:尊敬的投资者您好!公司是中国首家在海外建厂并最早在海外多个国家拥有规模化轮胎生产基地的轮胎企业。截至目前,公司海外共规划年生产 975万条全钢子午胎、4,900 万条半钢子午胎和 13.7 万吨非公路轮胎的生产能力,是目前海外布局产能规模最大的中国轮胎企业。感谢您对公司的关注。
## 27、尊敬的李董,您好! 我注意到公司在解释上半年净利下降的原因之一是国际贸易壁垒。请问:以您所掌握的信息来看,下半年美对越、柬的关税政策还会有什么变化?如果维持现有关税不变,下半年公司是否有改善净利状况的举措?谢谢!
答:尊敬的投资者您好!根据现有规则,墨西哥出口至美国的半钢胎符合《美墨加协定》中的免税条款。越南、柬埔寨和印尼,公司的乘用车及轻卡车轮胎适用于汽车零部件 232 条款中 25%的税率;其他轮胎产品适用对等关税:柬埔寨及印尼税率 19%,越南税率20%。目前公司生产经营正常。感谢您对公司的关注。
p. 8 · Read in context →
Shandong Linglong Tyre Co., Ltd. (玲珑轮胎) (601966.SS)
The other Chinese producer with a large Thai plant, and the peer that discloses the most granular plant-level capacity and utilisation in this set — including its Thai lines, which is the closest available public read on how a Chinese-owned Thai base was running in 2025. Linglong is semi-steel-led where Prinx is all-steel-led, so the overlap is strongest in Prinx's passenger-tyre business and in the shared Southeast Asian export channel rather than in truck tyres. Only the tyre operations are drawn on.
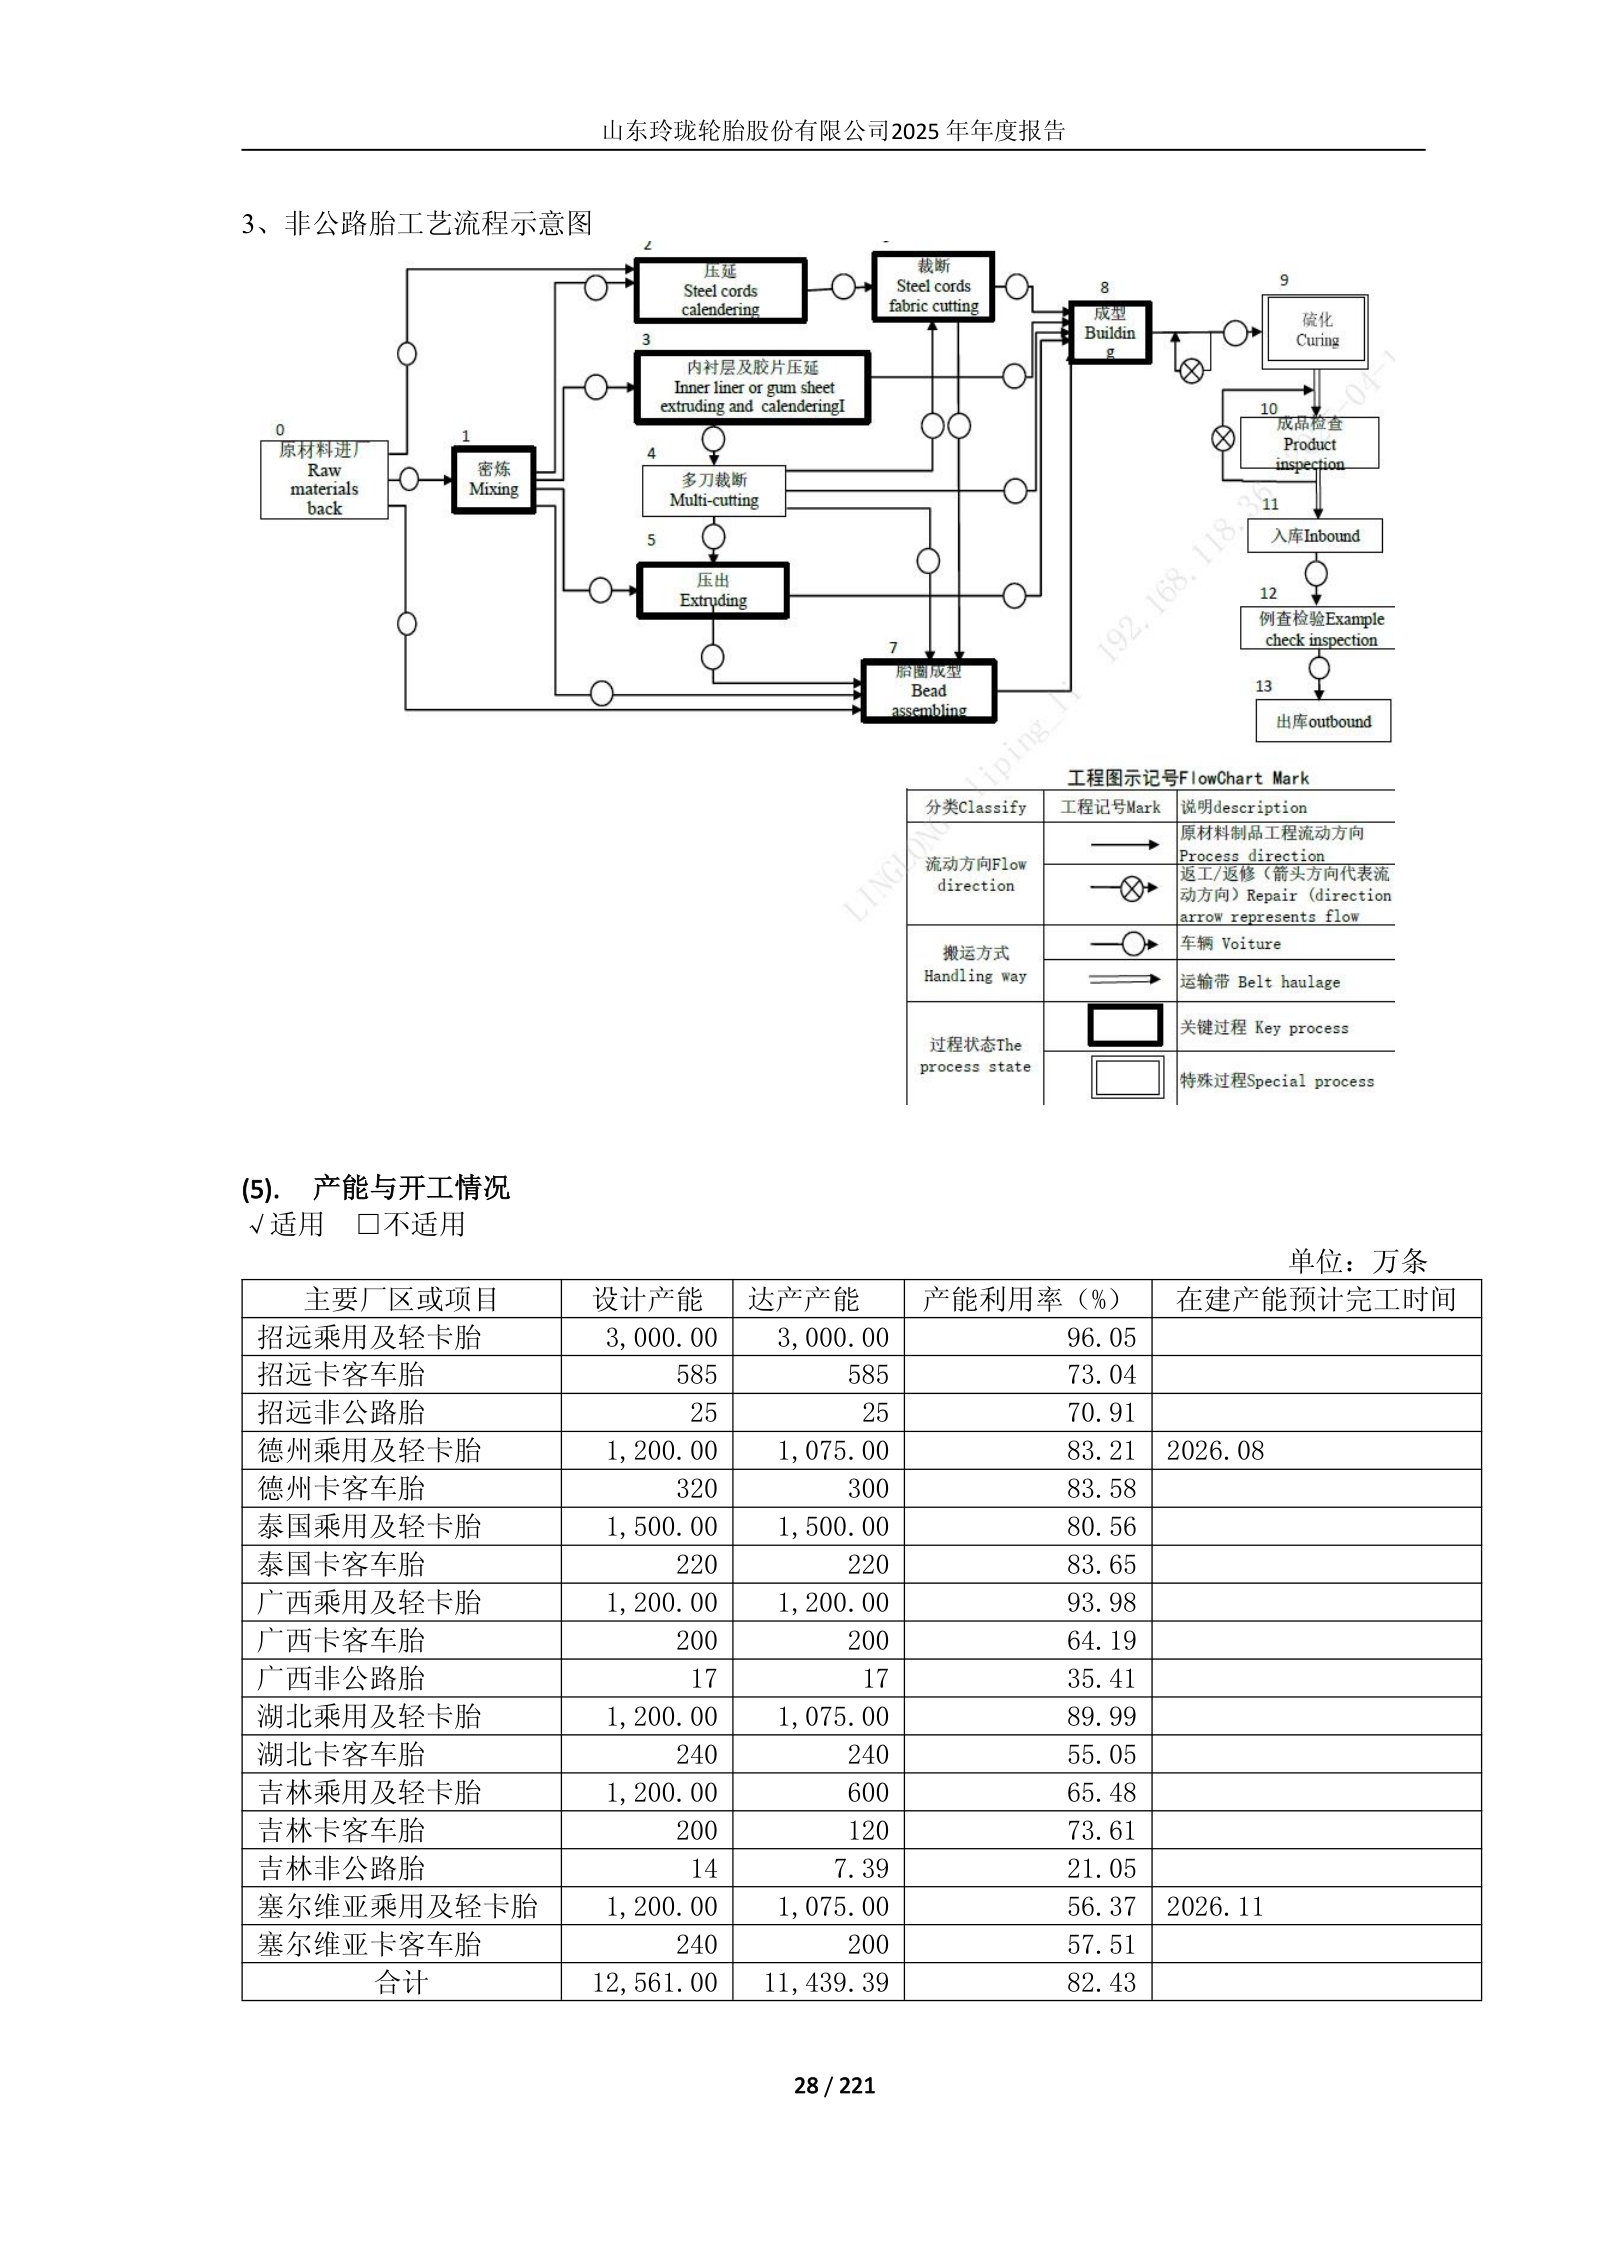
Linglong's inventory of the barriers facing Chinese tyre exports in 2025, and the broadest one in the peer set. The paragraph begins on page 10 and runs onto page 11 of the filing. It lists the US 10% baseline tariff imposed in April under a declared national emergency plus differentiated higher reciprocal rates on large-deficit partners; the EU anti-dumping investigation into passenger and light-truck tyres opened in May and the countervailing investigation added in November; Colombia's anti-dumping investigation into new Chinese truck and bus tyres opened on 21 October 2025; and the Eurasian Economic Commission's second sunset review of Chinese truck tyres of 17.5-24.5 inch rim diameter, opened 14 November 2025, under which existing duties of 14.79%-35.35% may continue. The item that reaches furthest into Prinx's own structure is the last: from September, Vietnam, Thailand and Malaysia began tightening enforcement against false country-of-origin declarations, with punitive tariffs of up to 40% on transshipped goods that fail a substantial-transformation test, stacking on top of existing US Section 232 and Section 301 duties. Prinx manufactures in Thailand and is building in Malaysia, so origin-rule enforcement in both jurisdictions is a live compliance and cost variable rather than a distant risk. This is Linglong's summary of measures rather than the legal instruments; the 40% figure is characterised as a maximum and is not attributed to a specific ruling. The same page also gives Linglong's market sizing — 1.207bn casings, up 1.72%; automotive tyre output 834m units, down 1.59%; all-steel 149m units, up 7.19%; semi-steel 684m units, up 1.33%; exports 472m units, down 0.64%, still 57% of automotive output — figures that do not reconcile with Triangle's on the same year.
2025 年,全球贸易环境面临严峻挑战,突出表现为“关税壁垒高企”与“绿色壁垒升级”的双重压力,共同构成了对企业出口成本、供应链管理能力和市场准入的系统性挑战。在关税方面,美国于 4 月以“国家紧急状态”为由对全球商品加征 10%基准关税,并对主要贸易逆差国实施差别化更高的“对等关税”,显著推高输美成本。同时,欧盟对乘用车及轻卡轮胎密集发起反倾销(5 月)和反补贴(11 月)调查。哥伦比亚 2025 年 10 月 21 日对原产于中国的新卡客车轮胎(税号 4011.20.10.00)启动反倾销调查。2025 年 11 月 14 日,欧亚经济委员会对华载重轮胎(轮辋直径 17.5-24.5 英寸)启动第二次日落复审,原税率 14.79%-35.35%可能延续。东南亚国家(越南、泰国、马来西亚等)自 9 月起严查“虚假原产地”,对未满足“实质性转化”的转口商品征收高达 40%的惩罚性关税,叠加美国原有的 232、301 等关税,形成多类、高额、叠加的税负壁垒。
p. 10 · Read in context →
Linglong's stated global plan, the "7+5" layout: seven domestic bases and five overseas, with a "3+3" off-road tyre programme embedded inside it — off-road capacity planned at three Chinese and three overseas bases. The rationale management gives is service radius to vehicle makers, faster delivery and localised R&D, manufacturing, marketing and service, aimed at a 2030 medium-term target. Two pages later the report identifies the components: Thailand as the first overseas base, in the WHA Eastern Seaboard industrial estate, described as strategically important and holding a warehouse adding over 1.2m tyres of storage since May 2021; Serbia as the European bridgehead and second overseas base; and Brazil as the third, planned with a 35 MW solar plant. Prinx's Thai base sits in the same Thai industrial-estate cluster and serves the same US and European replacement channels, so the overlap is direct. This is a strategy statement: the seven-plus-five count includes bases not yet built, and the capacity table earlier in this tab is the better guide to what is actually running.
基于加快构建以国内大循环为主体、国内国际双循环相互促进的新发展格局,公司推行“7+5”战略布局(即国内 7个基地、海外 5 个基地)。同时,为丰富产品种类,提升企业综合竞争力,公司又在“7+5”全球战略中嵌入“3+3”非公路轮胎产业布局(即在国内 3个基地、海外 3 个基地均规划建设非公路轮胎产能),对非公路轮胎领域进行全面升级。
通过“7+5”战略布局,在全球范围内形成与主机厂配套的最佳服务半径,亦可全面赋能零售服务体系,大幅提升交付效率,推进研发、管理、制造、营销、运营、服务的全球化、区域化和本土化发展,并通过人工智能、大数据、区块链、5G、工业机器人等尖端技术的应用,实现产品的全生命周期覆盖,使新建工厂的智能化水平、工艺设备先进程度达到国内领先、世界一流水平!未来公司将保持战略定力,向着 2030 年中长期发展目标坚毅前行。
p. 15 · Read in context →
Guizhou Tyre Co., Ltd. (贵州轮胎) (000589.SZ)
Prinx's nearest revenue twin among the A-share peers — FY2025 revenue of RMB10.95bn against Prinx's RMB11.81bn — and the closest match on product mix, running truck and bus radials alongside off-road, agricultural, industrial and bias tyres. Like Prinx it has one operating overseas base and a second under development, so its disclosures track the same decision Prinx is making with Malaysia. It also reports the industry capacity-load statistics that neither Prinx nor the other peers publish.
The oversupply evidence, from a peer's industry section. Guizhou cites the National Bureau of Statistics and Customs for 2025 Chinese rubber tyre casing output including motorcycle tyres of 1.207bn units, up 0.9%, and notes the growth rate narrowed by 8.3 percentage points against the prior year — the same headline number Triangle and General Science report, with the deceleration made explicit. Exports were 8.933m tonnes and US$21.52bn, up 2.9% by weight and 0.7% by value, so tonnage again grew four times faster than value. The second sentence is the one without an equivalent elsewhere in this tab: per the tyre branch's survey of key producers, average 2025 capacity load factors were 74.2% for all-steel and 79.5% for semi-steel, down 0.1 and 9.6 percentage points respectively. A near-ten-point fall in semi-steel loading is the industry backdrop against which Prinx's own semi-steel volumes grew 4.7% and its group gross profit fell 8.2%. These are survey averages across selected producers, not a census, and the association's series is not reconciled to the statistics-bureau output figure above it.
据国家统计局及海关总署公布的数据,2025 年我国橡胶轮胎外胎产量(含摩托车胎)达 12.07亿条,同比增长 0.9%,增幅较上年收窄 8.3 个百分点,增速较往年显著放缓。2025 年,我国累计出口轮胎 893.3 万吨和 215.2 亿美元,累计增幅为 2.9%和 0.7%。
据轮胎分会重点单位统计,2025年国内全钢胎和半钢胎平均产能负荷率分别为74.2%和79.5%,较上年分别下降0.1个百分点和9.6个百分点。
p. 16 · Read in context →
A peer's own placement in the two rankings this industry is scored on. In the China Rubber magazine "2025 Chinese Tyre Enterprise Ranking" published in August 2025, Guizhou Tyre placed 7th, up one position; in Tire Business's "2025 Global Tire 75", compiled on 2024 sales, it placed 24th, also up one. This is useful mainly as calibration: Guizhou reports FY2025 revenue of RMB10.95bn against Prinx's RMB11.81bn, so a company of Prinx's size sits around the top ten domestically and in the low-to-mid twenties globally. Both rankings are third-party compilations on revenue, published with a one-year lag in the Tire Business case, and neither measures share of any defined market. Sailun's exhibit above draws on the same Global Tire 75 for the top-three share figure.
在《中国橡胶》杂志社 2025年8 月公布的“2025 年度中国轮胎企业排行榜”中,公司排名第 7,较上年上升1 位。在美国《Tire Business》根据各企业 2024 年销售额发布的最新“2025 全球轮胎 75 强”中,公司排名第 24,较上一年度上升 1 位。
p. 10 · Read in context →
More peer documents
Jiangsu General Science Technology — 2024 Annual Report — FY2024 · 299 pages · Carries the same trade-barrier section a year earlier, including the January 2024 final determination on Thai passenger and light-truck tyres (Sentury Thailand 1.24%, Sumitomo Thailand 6.16%, 4.52% all-others) alongside the Prinx Chengshan 12.33% truck-tyre line — the two-product view of Thailand's US duty exposure. Page 35 has the prior-year plant utilisation table for the Thai and Cambodian bases. · Open →
Sailun Group — 2024 Annual Report — FY2024 · 259 pages · The 2024 baseline for the market sizing used above: page 16 puts Chinese automotive casing output at 847m units, up 7.8%, with all-steel truck tyres at 139m units, down 4.1%, and cites Michelin for a 36.7% top-three global share in 2023, down 2.2 points — the prior reading of the 35% figure in the exhibit above. · Open →
Sailun Group — investor relations record, results briefing of 21 May 2025 — Q1 FY2025 · 7 pages · Question 15 gives installed annualised overseas capacity plant by plant — Vietnam 2.6m all-steel, 16m semi-steel and 100k tonnes off-road excluding the ACTR joint venture; ACTR 2.65m all-steel; Cambodia 1.65m all-steel and 19m semi-steel — the installed counterpart to the planned figures quoted in this tab. · Open →
Sailun Group — investor relations record, results briefing of 4 November 2025 — Q3 FY2025 · 9 pages · Question 9 is the clearest peer statement on the EU investigation's second-order effect: Sailun says its EU-bound semi-steel orders have already moved to overseas plants and that domestic production remains export-led, which is the competitive pressure Prinx's Shandong base faces. Question 4 covers the off-road build-out against Linglong's 63-inch giant tyre. · Open →
Sailun Group — investor relations record, results briefing of 8 May 2026 — Q4 FY2025 · 16 pages · The most recent peer commentary in the set. Management states it has already raised prices in response to rising raw-material costs, sets out the Egyptian plant's 9m semi-steel and 1.65m all-steel target, and describes the channel build across 180-plus countries — the pricing and channel questions a Prinx reader carries into 2026. · Open →
Shandong Linglong Tyre — 2024 Annual Report — FY2024 · 234 pages · Page 27 has the prior-year version of the plant capacity table used above, which is what turns it into a trend: Thai passenger utilisation was 97% in 2024 against 80.56% in 2025, and Thai truck 46% against 83.65% — a large swing in the base most comparable to Prinx Thailand. · Open →
Triangle Tyre — 2024 Annual Report — FY2024 · 159 pages · The base year for the 18% replacement collapse quoted above. Page 27 carries the same plant-level capacity table, showing 26.88m sets of design capacity at 91.20% blended utilisation in 2024 against 89.61% in 2025, with the commercial-tyre plant at 89.91% falling to 88.88%. · Open →
Source: S&P Capital IQ transcripts via Xpressfeed · latest indexed call 2021-08-31 · generated 2026-08-03.
Latest call digest
Prinx Chengshan Holdings Limited, H1 2021 Earnings Call, Aug 31, 2021 · 2021-08-31T08:30:00
H1 2021 results call, 31 August 2021. The prepared remarks and the reported numbers pointed in opposite directions, and management did not hide the gap.
CEO Baozhen Che led with growth: Shandong and Thailand ran 715万套 of all-steel and 1,240万套 of semi-steel capacity with a further 225万套 and 680万套 planned; a new Anhui plant (phase 1: 80万套 all-steel, 500万套 semi-steel) was announced for construction in H2 2021 and production by end-2022; the European central warehouse came online; Prinx Chengshan moved up two places to 29th on Tyrepress's global ranking. Utilisation slipped below the 2020 level, which Che attributed to supply-chain and delivery constraints rather than order shortfall.
CFO Futao Shi's section was the harder half. Volume of 909万条 and exports up 85.9% (273万套 to 507万套) carried revenue from 人民币28亿元 to 人民币37.5亿元, of which 人民币6.7亿元 of the 人民币9亿元 increase came from Thailand. But gross margin fell from 21.3% to 16.5%, net margin from 9.3% to 6.5%, and net profit declined in absolute terms from 人民币2.65亿元 to 人民币2.45亿元. All-steel gross margin dropped from 22% to 16.5%; semi-steel from 17.3% to 15.9%. Thailand held above 22% gross margin against Shandong's 15.3%. Operating cash flow was negative 人民币1.36亿元 — described as the first time in the company's history — on 人民币3.96亿元 of Thailand-related receivables and inventory build. ROE fell from 15.2% to 12.8%, the equity ratio from 55.8% to 43.9%, EPS from 人民币0.42元 to 人民币0.39元. Geographic mix shifted sharply: mainland China from 66% to 51% of revenue, the US from 4% to 18%.
Q&A concentrated on the three costs squeezing the P&L — raw materials, freight and FX — plus the capital commitment behind Anhui. Management's stated view was that raw-material prices are near a high and more likely to fall than rise, that natural rubber should trade in a narrow band over the next six to twelve months, and that freight (up 5-7x, roughly 人民币2,000万元 a month for Thailand alone) will not ease materially before year-end. Shi said near-term margin improvement would be difficult. On forward commitments the call was thinner than the prior one: Anhui phase-1 payback of about ten years, six to seven years if all three phases complete, and 人民币50亿元-60亿元 of revenue at full three-phase build; operating cash flow to improve in H2 and turn positive next year. No full-year 2021 revenue or margin target was restated.
Participant coverage from the latest call.
| Group | Participants | Count |
|---|---|---|
| Management | 主持人; Baozhen Che — Executive Director, Prinx Chengshan Holdings Limited; Futao Shi — Executive Director, Prinx Chengshan Holdings Limited | 3 |
| Analysts | 参会者 | 1 |
Curated latest-call exchanges; one row per analyst topic.
| Analyst | Firm | Topic | What changed in Q&A |
|---|---|---|---|
| Nara | UBS | Rubber prices, Thai COVID situation, sea freight | Che opened by declining the framing — he called his answer a judgment, not guidance. Natural rubber: demand easing in H2 and supply easing too, so a narrow trading range over six to twelve months. On freight he was blunt: rates up 5-7x across all lanes with no clear sign of relief before year-end, and roughly 人民币2,000万元 a month of freight cost for the Thailand plant alone. Deliveries continued, less efficiently. Thailand daily cases had spiked before easing; no plant infections. |
| 李鸿钊 | CITIC Securities | Anhui plant siting and channel mix | Che gave three reasons for Anhui after a year-long national search: logistics complementarity with Shandong (which favours import/export), proximity to what he sees as a coming NEV cluster, and local government efficiency. Product plan: 1,000万条 semi-steel, 200万条 all-steel plus new lines in OTR and rubber auto components. He said the OE proportion will exceed Shandong's but declined to give a ratio, citing 2023 Q1 start-up and ongoing customer discussions. |
| 李鸿钊 | CITIC Securities | Anhui project returns and group ROIC | Shi answered on payback rather than on ROIC: phase 1 alone about ten years, six to seven years if all three phases are built, with 人民币50亿元-60亿元 of revenue at full three-phase capacity. He gave no profit or margin figure for the project and did not address the group capital-return question. |
| 马寿丹 | Guotai Junan Securities | Who bears freight cost, chip shortage, US market growth | The hardest single exchange. Che disclosed the split — under 10% of Shandong export freight borne by the company, under 50% for Thailand — but on the specific ask, freight as a share of manufacturing cost, said the company has no accurate number, offering only that it is certainly under 1% of revenue and that a proper figure might be computed later. On chips he sized the impact at roughly 7% of global auto output this year. US revenue share went 4% to 18% purely because Thailand serves US customers that Shandong cannot, given anti-dumping duties and Trump-era tariffs. |
| Emma Shan | Orient Securities | H2 gross margin, cost pass-through, raw-material inventory policy | Shi conceded that near-term margin improvement is difficult, blaming freight for absorbing the pass-through and describing a lag in domestic price transmission he called unprecedented. Che added that a price-transmission gap exists industry-wide and that pressure remains high, though he expects the gap to narrow. On stockpiling ahead of price rises he was direct: natural rubber turns in 40-50 days, short-chain inputs 10-20 days, and the company will not materially extend that to bet on prices because risk and reward are symmetric. |
| 马群星 | Guolian Securities | Scale versus industry leaders; product differentiation | Che said completed expansion plans could put the company in the industry's top five or top four in the next few years, adding that it depends partly on how hard competitors work. On differentiation he pointed to NEV-specific passenger tyres — he cited forecasts of NEVs near 20% of auto sales by 2025 and up to 30% by 2030 — and to commercial fleets shifting from load durability to total lifecycle cost, rolling resistance, fuel burn and unplanned downtime. |
| Casey | Share Capital | Overseas strategy | The question was vague enough that Che asked the analyst to confirm it meant international markets. He then laid out a two-pole structure — North America and Europe carrying own-brand and own-channel build-out, with the Middle East, Africa, Latin America and Southeast Asia as traditional-channel supplements — and said Europe should see a step-change in H1 2022. |
| James Zhang | Qianhai Capital | M&A plans | Che said plainly there is no defined target or plan, then set out principles: growth via both organic build and acquisition, and any deal must support the core business strategically rather than being a financial investment. He repeated the no-current-plan point at the end. |
Theme tracker
Themes are curator-classified across supplied calls.
| Theme | Status | Quarters mentioned | Read-through |
|---|---|---|---|
| Thailand ramp and the export mix it carries | persisted | FY2020 (Mar 2021 call), H1 2021 (Aug 2021 call) | Central to both calls, but the register changed. In March the plant was a promise being delivered — phase 1 fully ramped in Q4 2020 after COVID delays, profitable in November and December. By August it was the main engine of reported growth (人民币6.7亿元 of the 人民币9亿元 revenue increase) and simultaneously the source of the first negative operating cash flow, through Thailand receivables and inventory. |
| Raw-material cost and price pass-through | persisted | FY2020 (Mar 2021 call), H1 2021 (Aug 2021 call) | Asked first in both calls. In March the FY2020 margin expansion (19.2% to 22.3%) was itself attributed to falling input costs, and Che argued the coming rise would pass through smoothly. By August cost inflation of 11-17% had been met with only an 8% price increase, and both executives described the pass-through gap as still open. |
| US market access and trade remedies | persisted | FY2020 (Mar 2021 call), H1 2021 (Aug 2021 call) | In March the topic was defensive — the 16.6% Thai anti-dumping rate against a 13-22% country range, which management said came in below market expectations. By August it was the growth story: US revenue share 4% to 18%, explicitly because Thailand routes around the duties and tariffs facing mainland output. |
| Chip shortage and OE tyre demand | persisted | FY2020 (Mar 2021 call), H1 2021 (Aug 2021 call) | Raised by an analyst in both calls, and management's estimate of the damage grew. In March Che cited a 5-7% hit to global passenger vehicle sales and judged the effect on Prinx Chengshan limited because its OE book skews to trucks and buses. In August he put the impact at roughly 7% of global auto output and added a second-order point: OEMs under pressure are shifting procurement from international to Chinese brands. |
| Europe build-out | persisted | FY2020 (Mar 2021 call), H1 2021 (Aug 2021 call) | In March, Europe was described as deliberately not broken out because EU duties block mainland all-steel, with a plan to start Thai-sourced all-steel sales the following year. By August the European central warehouse was operating and Che was pointing to a step-change in H1 2022. The story has advanced but has still produced no disclosed Europe revenue figure in either call. |
| Sea freight and delivery capability | emerged | H1 2021 (Aug 2021 call) | Absent from the March call and pervasive in August — raised by two analysts, cited by management as the reason utilisation fell, as the mechanism absorbing price pass-through, and as roughly 人民币2,000万元 a month of cost at Thailand alone. This is the single largest change in the company's own framing between the two calls. |
| Domestic capacity expansion beyond Shandong (Anhui) | emerged | H1 2021 (Aug 2021 call) | First disclosed in August and the subject of three analyst questions. It commits capital into a period management simultaneously described as one of margin compression and negative operating cash flow, which is why the payback question drew attention. |
| Digital retail channel (小浦 platform) | emerged | H1 2021 (Aug 2021 call) | Launched April 2021 and, as Che acknowledged, not something management had intended to highlight — an analyst surfaced it. Presented as the first step of a broader semi-steel brand and channel programme linking factory, distributor and store. |
Guidance ledger
Quotes, calls, and speakers are source-verified; outcomes are curator-classified.
| Verbatim guidance | Call | Speaker | Curator outcome | Outcome note |
|---|---|---|---|---|
| No verified guidance quotes | — | — | — | — |
Q&A pressure map
Question counts and firms are curator tallies; analyst coverage shown above.
| Topic | Questions | Firms | Pressure / response |
|---|---|---|---|
| Raw-material prices, gross margin and pass-through | 3 | Guotai Junan Securities, UBS, Orient Securities | The one topic pressed on both calls and the opening question on each. In March the challenge was whether rising inputs could be passed on; Che answered with the cost-plus pricing model, an October-November 2020 price adjustment, and a contrast to the 2017 spike. In August, with the answer visibly wrong, analysts pushed on H2 direction, pass-through ability and inventory policy. Shi's reply that near-term margin improvement is difficult was the most direct concession on either call. |
| Thailand plant — tariffs, ramp, economics | 4 | Guotai Junan Securities, UBS | Four question components across the two calls, including a follow-up in March pressing whether the anti-dumping rate really left Thai profitability intact, and a March question on Thailand's 2020 margin and 2021 revenue contribution from a participant management addressed as Alison whose firm the transcript does not record. Answers were specific throughout — 16.6% duty, daily output, headcount, the 人民币5,000万元 2020 loss. |
| Sea freight and delivery | 2 | UBS, Guotai Junan Securities | New in August. Worth flagging one gap: asked directly what percentage of cost freight represents, management said it had no accurate figure, gave only a ceiling against revenue of under 1%, and suggested a proper number might be calculated later. The bearing split (under 10% of Shandong exports, under 50% of Thailand's) was disclosed, so this reads as a genuine measurement gap rather than deflection — but the specific number asked for was not provided. |
| Chip shortage and OE demand | 2 | Guotai Junan Securities | Asked on both calls; the March questioner's firm is not recorded in the transcript. Management sized the industry hit both times (5-7% of global passenger vehicle sales in March, roughly 7% of global auto output in August) and in March argued company exposure was limited by its truck and bus OE skew while conceding the future semi-steel OE push would be more exposed. |
| Capacity expansion, Anhui and competitive scale | 3 | CITIC Securities, Guolian Securities | Concentrated entirely in August. Analysts pressed on siting logic, sales mix, project returns and whether the gap to the industry leaders narrows. Two answers stopped short: the OE-versus-replacement split for Anhui was declined as not yet determinable, and the question about group capital-return impact was answered with project payback instead. |
| Overseas channel development — Europe, US, distributors | 4 | UBS, Guotai Junan Securities, Share Capital | Persistent across both calls. Europe drew a pointed March question about why no results were shown despite a standing European team; Che explained the duty barrier on mainland all-steel and said Europe's revenue and profit both grew, without giving figures. No Europe number has been disclosed on either call, which remains the softest spot in an otherwise specific international disclosure. |
Language shifts
Only language evidence verified against the referenced component is shown.
| Observation | Verbatim evidence | Call ID | Component |
|---|---|---|---|
| No verified language shifts | — | — | — |
Two calls is not a track record, and the gap between them should be read as one observation rather than a trend. That said, the observation is a clean one: the same management team that in March argued input-cost inflation would pass through over an annual cycle reported six months later that it had not, with gross margin down from 21.3% to 16.5%, net profit lower in absolute terms even as revenue rose from 人民币28亿元 to 人民币37.5亿元, and operating cash flow negative for the first time. The growth engine and the margin problem are the same asset — Thailand drove the revenue increase and the working-capital drain alike — and management committed to a third plant while both were true. The debate the call history sharpens is whether volume and geographic mix can outrun a pass-through gap management itself has stopped promising to close on a defined timetable.